Palestinian vs Immigrants from Syria No Schooling Completed
COMPARE
Palestinian
Immigrants from Syria
No Schooling Completed
No Schooling Completed Comparison
Palestinians
Immigrants from Syria
1.9%
NO SCHOOLING COMPLETED
91.8/ 100
METRIC RATING
130th/ 347
METRIC RANK
2.3%
NO SCHOOLING COMPLETED
6.6/ 100
METRIC RATING
217th/ 347
METRIC RANK
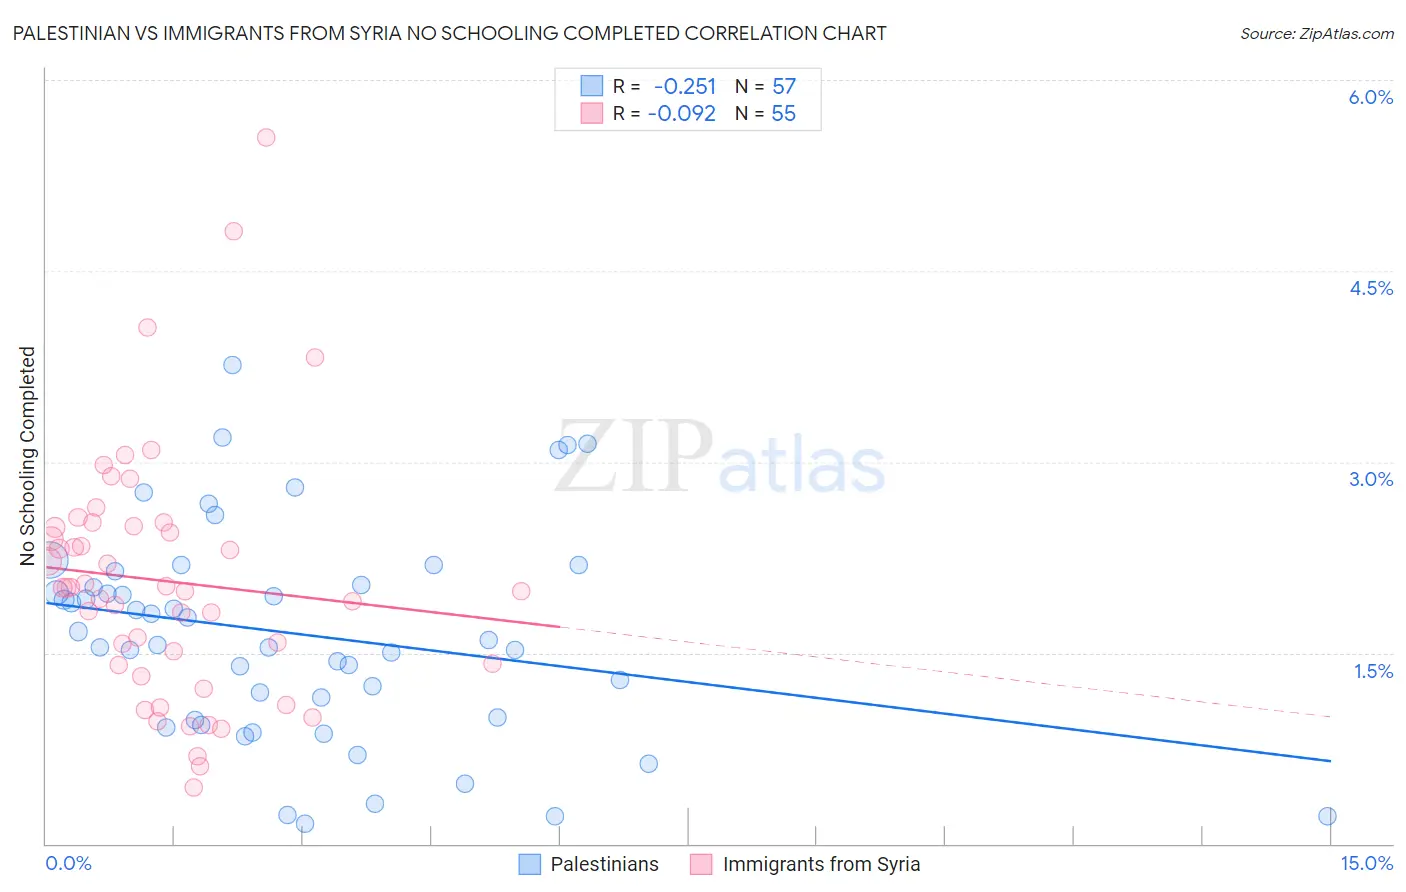
Palestinian vs Immigrants from Syria No Schooling Completed Correlation Chart
The statistical analysis conducted on geographies consisting of 215,613,106 people shows a weak negative correlation between the proportion of Palestinians and percentage of population with no schooling in the United States with a correlation coefficient (R) of -0.251 and weighted average of 1.9%. Similarly, the statistical analysis conducted on geographies consisting of 173,620,316 people shows a slight negative correlation between the proportion of Immigrants from Syria and percentage of population with no schooling in the United States with a correlation coefficient (R) of -0.092 and weighted average of 2.3%, a difference of 18.5%.
No Schooling Completed Correlation Summary
| Measurement | Palestinian | Immigrants from Syria |
| Minimum | 0.16% | 0.44% |
| Maximum | 3.8% | 5.6% |
| Range | 3.6% | 5.1% |
| Mean | 1.6% | 2.1% |
| Median | 1.6% | 2.0% |
| Interquartile 25% (IQ1) | 0.98% | 1.4% |
| Interquartile 75% (IQ3) | 2.1% | 2.5% |
| Interquartile Range (IQR) | 1.1% | 1.1% |
| Standard Deviation (Sample) | 0.83% | 0.98% |
| Standard Deviation (Population) | 0.82% | 0.97% |
Similar Demographics by No Schooling Completed
Demographics Similar to Palestinians by No Schooling Completed
In terms of no schooling completed, the demographic groups most similar to Palestinians are Seminole (1.9%, a difference of 0.11%), Immigrants from Hungary (1.9%, a difference of 0.11%), Spaniard (1.9%, a difference of 0.25%), Israeli (1.9%, a difference of 0.33%), and Immigrants from Romania (1.9%, a difference of 0.40%).
| Demographics | Rating | Rank | No Schooling Completed |
| Immigrants | Kuwait | 93.9 /100 | #123 | Exceptional 1.9% |
| Cambodians | 93.8 /100 | #124 | Exceptional 1.9% |
| Immigrants | Europe | 93.7 /100 | #125 | Exceptional 1.9% |
| Immigrants | Romania | 92.6 /100 | #126 | Exceptional 1.9% |
| Israelis | 92.4 /100 | #127 | Exceptional 1.9% |
| Spaniards | 92.3 /100 | #128 | Exceptional 1.9% |
| Seminole | 92.0 /100 | #129 | Exceptional 1.9% |
| Palestinians | 91.8 /100 | #130 | Exceptional 1.9% |
| Immigrants | Hungary | 91.6 /100 | #131 | Exceptional 1.9% |
| Colville | 90.4 /100 | #132 | Exceptional 1.9% |
| Immigrants | Turkey | 90.2 /100 | #133 | Exceptional 1.9% |
| Menominee | 89.6 /100 | #134 | Excellent 1.9% |
| Hmong | 88.5 /100 | #135 | Excellent 1.9% |
| Burmese | 88.2 /100 | #136 | Excellent 1.9% |
| Filipinos | 85.5 /100 | #137 | Excellent 2.0% |
Demographics Similar to Immigrants from Syria by No Schooling Completed
In terms of no schooling completed, the demographic groups most similar to Immigrants from Syria are Tongan (2.3%, a difference of 0.090%), Immigrants from Nepal (2.3%, a difference of 0.11%), Immigrants from Zaire (2.3%, a difference of 0.28%), Senegalese (2.3%, a difference of 0.55%), and Samoan (2.3%, a difference of 0.72%).
| Demographics | Rating | Rank | No Schooling Completed |
| Natives/Alaskans | 10.0 /100 | #210 | Tragic 2.2% |
| Immigrants | Panama | 8.8 /100 | #211 | Tragic 2.3% |
| Immigrants | Morocco | 8.7 /100 | #212 | Tragic 2.3% |
| Ute | 8.2 /100 | #213 | Tragic 2.3% |
| Samoans | 8.2 /100 | #214 | Tragic 2.3% |
| Immigrants | Zaire | 7.2 /100 | #215 | Tragic 2.3% |
| Tongans | 6.8 /100 | #216 | Tragic 2.3% |
| Immigrants | Syria | 6.6 /100 | #217 | Tragic 2.3% |
| Immigrants | Nepal | 6.4 /100 | #218 | Tragic 2.3% |
| Senegalese | 5.6 /100 | #219 | Tragic 2.3% |
| Immigrants | Costa Rica | 5.1 /100 | #220 | Tragic 2.3% |
| Immigrants | Sudan | 5.0 /100 | #221 | Tragic 2.3% |
| Sub-Saharan Africans | 4.7 /100 | #222 | Tragic 2.3% |
| Immigrants | Lebanon | 4.5 /100 | #223 | Tragic 2.3% |
| Tohono O'odham | 4.1 /100 | #224 | Tragic 2.3% |