Panamanian vs Immigrants from Syria No Schooling Completed
COMPARE
Panamanian
Immigrants from Syria
No Schooling Completed
No Schooling Completed Comparison
Panamanians
Immigrants from Syria
2.1%
NO SCHOOLING COMPLETED
45.2/ 100
METRIC RATING
176th/ 347
METRIC RANK
2.3%
NO SCHOOLING COMPLETED
6.6/ 100
METRIC RATING
217th/ 347
METRIC RANK
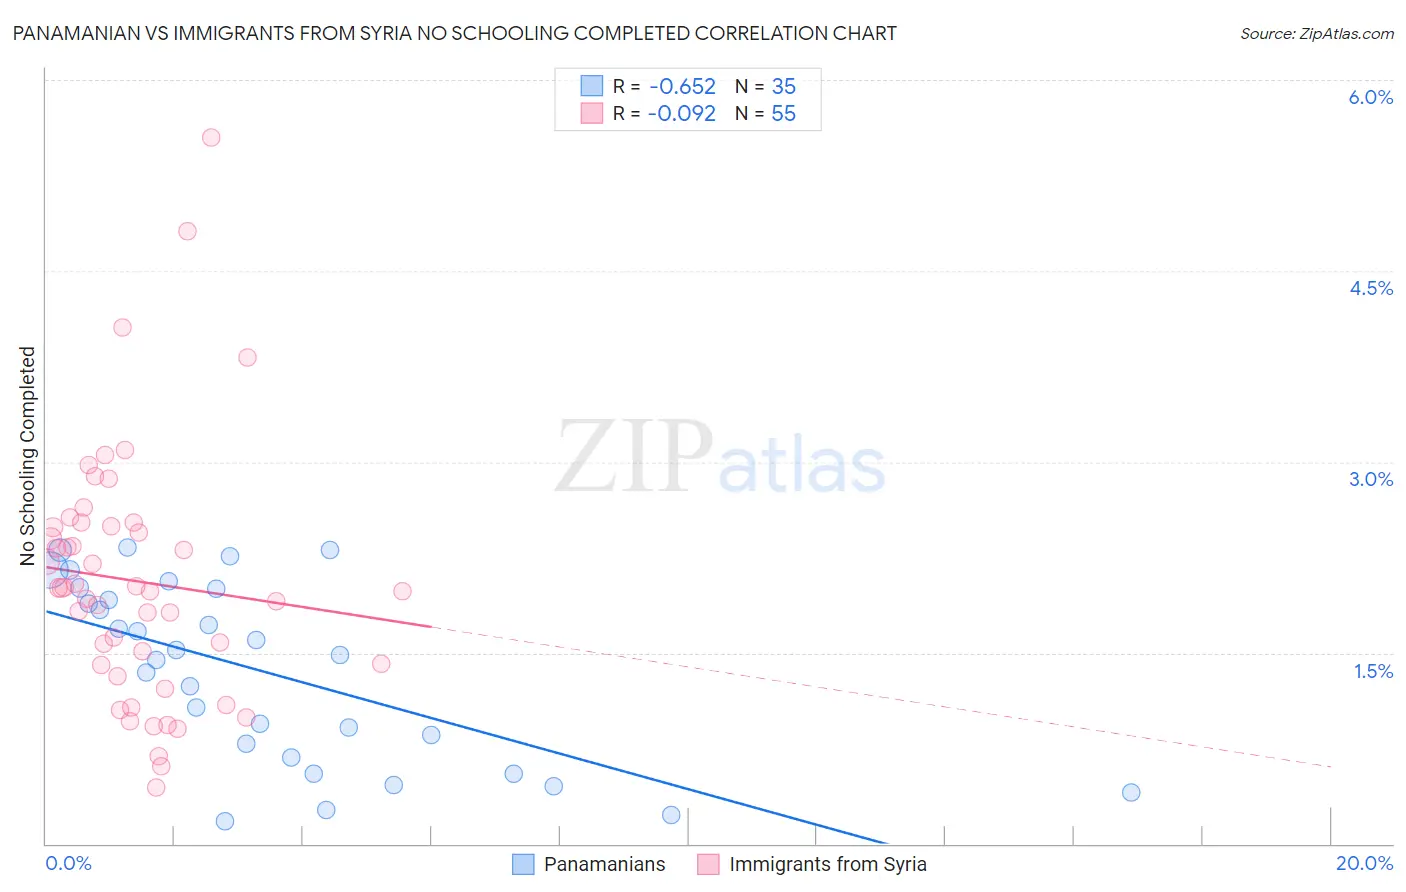
Panamanian vs Immigrants from Syria No Schooling Completed Correlation Chart
The statistical analysis conducted on geographies consisting of 279,950,007 people shows a significant negative correlation between the proportion of Panamanians and percentage of population with no schooling in the United States with a correlation coefficient (R) of -0.652 and weighted average of 2.1%. Similarly, the statistical analysis conducted on geographies consisting of 173,620,316 people shows a slight negative correlation between the proportion of Immigrants from Syria and percentage of population with no schooling in the United States with a correlation coefficient (R) of -0.092 and weighted average of 2.3%, a difference of 8.2%.
No Schooling Completed Correlation Summary
| Measurement | Panamanian | Immigrants from Syria |
| Minimum | 0.18% | 0.44% |
| Maximum | 2.3% | 5.6% |
| Range | 2.1% | 5.1% |
| Mean | 1.4% | 2.1% |
| Median | 1.5% | 2.0% |
| Interquartile 25% (IQ1) | 0.68% | 1.4% |
| Interquartile 75% (IQ3) | 2.0% | 2.5% |
| Interquartile Range (IQR) | 1.3% | 1.1% |
| Standard Deviation (Sample) | 0.70% | 0.98% |
| Standard Deviation (Population) | 0.69% | 0.97% |
Similar Demographics by No Schooling Completed
Demographics Similar to Panamanians by No Schooling Completed
In terms of no schooling completed, the demographic groups most similar to Panamanians are Arapaho (2.1%, a difference of 0.020%), Pakistani (2.1%, a difference of 0.060%), Immigrants from Kazakhstan (2.1%, a difference of 0.11%), Arab (2.1%, a difference of 0.17%), and Portuguese (2.1%, a difference of 0.17%).
| Demographics | Rating | Rank | No Schooling Completed |
| Apache | 56.7 /100 | #169 | Average 2.1% |
| Argentineans | 56.0 /100 | #170 | Average 2.1% |
| Immigrants | Poland | 55.2 /100 | #171 | Average 2.1% |
| Immigrants | Argentina | 52.7 /100 | #172 | Average 2.1% |
| Immigrants | Belarus | 51.8 /100 | #173 | Average 2.1% |
| Immigrants | Micronesia | 50.0 /100 | #174 | Average 2.1% |
| Arabs | 46.4 /100 | #175 | Average 2.1% |
| Panamanians | 45.2 /100 | #176 | Average 2.1% |
| Arapaho | 45.0 /100 | #177 | Average 2.1% |
| Pakistanis | 44.7 /100 | #178 | Average 2.1% |
| Immigrants | Kazakhstan | 44.3 /100 | #179 | Average 2.1% |
| Portuguese | 43.9 /100 | #180 | Average 2.1% |
| Immigrants | Taiwan | 42.6 /100 | #181 | Average 2.1% |
| French American Indians | 42.2 /100 | #182 | Average 2.1% |
| Blacks/African Americans | 41.4 /100 | #183 | Average 2.1% |
Demographics Similar to Immigrants from Syria by No Schooling Completed
In terms of no schooling completed, the demographic groups most similar to Immigrants from Syria are Tongan (2.3%, a difference of 0.090%), Immigrants from Nepal (2.3%, a difference of 0.11%), Immigrants from Zaire (2.3%, a difference of 0.28%), Senegalese (2.3%, a difference of 0.55%), and Samoan (2.3%, a difference of 0.72%).
| Demographics | Rating | Rank | No Schooling Completed |
| Natives/Alaskans | 10.0 /100 | #210 | Tragic 2.2% |
| Immigrants | Panama | 8.8 /100 | #211 | Tragic 2.3% |
| Immigrants | Morocco | 8.7 /100 | #212 | Tragic 2.3% |
| Ute | 8.2 /100 | #213 | Tragic 2.3% |
| Samoans | 8.2 /100 | #214 | Tragic 2.3% |
| Immigrants | Zaire | 7.2 /100 | #215 | Tragic 2.3% |
| Tongans | 6.8 /100 | #216 | Tragic 2.3% |
| Immigrants | Syria | 6.6 /100 | #217 | Tragic 2.3% |
| Immigrants | Nepal | 6.4 /100 | #218 | Tragic 2.3% |
| Senegalese | 5.6 /100 | #219 | Tragic 2.3% |
| Immigrants | Costa Rica | 5.1 /100 | #220 | Tragic 2.3% |
| Immigrants | Sudan | 5.0 /100 | #221 | Tragic 2.3% |
| Sub-Saharan Africans | 4.7 /100 | #222 | Tragic 2.3% |
| Immigrants | Lebanon | 4.5 /100 | #223 | Tragic 2.3% |
| Tohono O'odham | 4.1 /100 | #224 | Tragic 2.3% |