Cajun vs Basque GED/Equivalency
COMPARE
Cajun
Basque
GED/Equivalency
GED/Equivalency Comparison
Cajuns
Basques
82.4%
GED/EQUIVALENCY
0.0/ 100
METRIC RATING
285th/ 347
METRIC RANK
86.4%
GED/EQUIVALENCY
79.5/ 100
METRIC RATING
146th/ 347
METRIC RANK
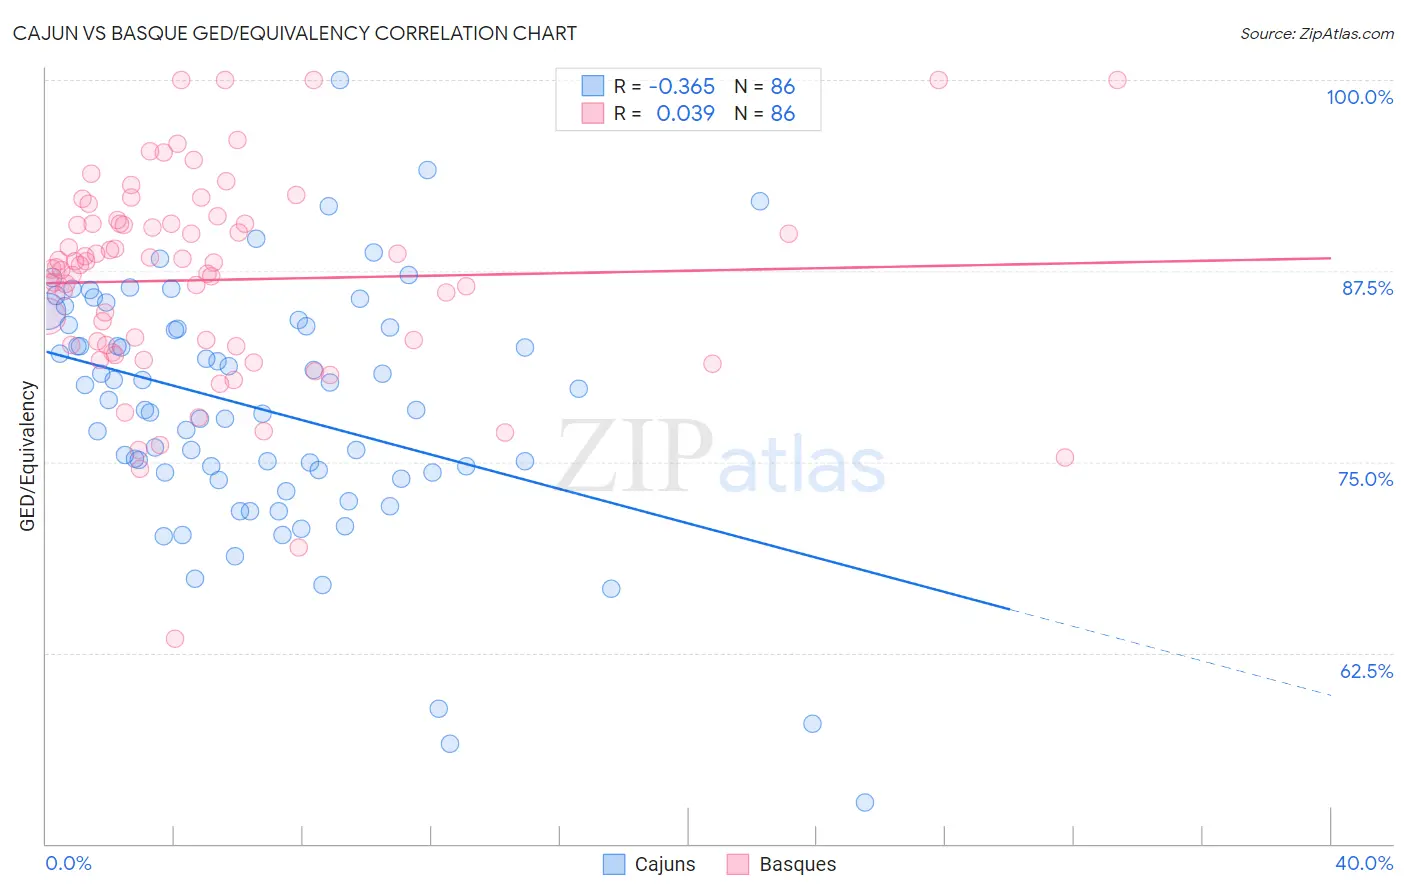
Cajun vs Basque GED/Equivalency Correlation Chart
The statistical analysis conducted on geographies consisting of 149,713,149 people shows a mild negative correlation between the proportion of Cajuns and percentage of population with at least ged/equivalency education in the United States with a correlation coefficient (R) of -0.365 and weighted average of 82.4%. Similarly, the statistical analysis conducted on geographies consisting of 165,778,463 people shows no correlation between the proportion of Basques and percentage of population with at least ged/equivalency education in the United States with a correlation coefficient (R) of 0.039 and weighted average of 86.4%, a difference of 4.8%.
GED/Equivalency Correlation Summary
| Measurement | Cajun | Basque |
| Minimum | 52.7% | 63.4% |
| Maximum | 100.0% | 100.0% |
| Range | 47.3% | 36.6% |
| Mean | 78.4% | 86.9% |
| Median | 78.7% | 87.8% |
| Interquartile 25% (IQ1) | 74.3% | 82.6% |
| Interquartile 75% (IQ3) | 83.9% | 90.6% |
| Interquartile Range (IQR) | 9.6% | 8.0% |
| Standard Deviation (Sample) | 8.1% | 6.8% |
| Standard Deviation (Population) | 8.1% | 6.7% |
Similar Demographics by GED/Equivalency
Demographics Similar to Cajuns by GED/Equivalency
In terms of ged/equivalency, the demographic groups most similar to Cajuns are Immigrants from West Indies (82.4%, a difference of 0.020%), Immigrants from Barbados (82.4%, a difference of 0.030%), Japanese (82.4%, a difference of 0.040%), Pueblo (82.3%, a difference of 0.14%), and Indonesian (82.5%, a difference of 0.15%).
| Demographics | Rating | Rank | GED/Equivalency |
| Immigrants | Laos | 0.1 /100 | #278 | Tragic 82.7% |
| Immigrants | Fiji | 0.1 /100 | #279 | Tragic 82.7% |
| Cheyenne | 0.1 /100 | #280 | Tragic 82.7% |
| Sioux | 0.1 /100 | #281 | Tragic 82.6% |
| Immigrants | Immigrants | 0.1 /100 | #282 | Tragic 82.6% |
| Indonesians | 0.1 /100 | #283 | Tragic 82.5% |
| Immigrants | Barbados | 0.1 /100 | #284 | Tragic 82.4% |
| Cajuns | 0.0 /100 | #285 | Tragic 82.4% |
| Immigrants | West Indies | 0.0 /100 | #286 | Tragic 82.4% |
| Japanese | 0.0 /100 | #287 | Tragic 82.4% |
| Pueblo | 0.0 /100 | #288 | Tragic 82.3% |
| Immigrants | Cambodia | 0.0 /100 | #289 | Tragic 82.2% |
| Haitians | 0.0 /100 | #290 | Tragic 82.1% |
| Cubans | 0.0 /100 | #291 | Tragic 82.0% |
| Paiute | 0.0 /100 | #292 | Tragic 82.0% |
Demographics Similar to Basques by GED/Equivalency
In terms of ged/equivalency, the demographic groups most similar to Basques are Immigrants from Northern Africa (86.3%, a difference of 0.0%), Immigrants from Poland (86.3%, a difference of 0.0%), Menominee (86.3%, a difference of 0.010%), Immigrants from Western Asia (86.3%, a difference of 0.020%), and Pakistani (86.4%, a difference of 0.030%).
| Demographics | Rating | Rank | GED/Equivalency |
| Immigrants | Malaysia | 85.0 /100 | #139 | Excellent 86.5% |
| Paraguayans | 84.1 /100 | #140 | Excellent 86.5% |
| Laotians | 83.2 /100 | #141 | Excellent 86.5% |
| Immigrants | Indonesia | 82.4 /100 | #142 | Excellent 86.4% |
| Immigrants | Pakistan | 82.4 /100 | #143 | Excellent 86.4% |
| Bolivians | 82.1 /100 | #144 | Excellent 86.4% |
| Pakistanis | 80.4 /100 | #145 | Excellent 86.4% |
| Basques | 79.5 /100 | #146 | Good 86.4% |
| Immigrants | Northern Africa | 79.3 /100 | #147 | Good 86.3% |
| Immigrants | Poland | 79.3 /100 | #148 | Good 86.3% |
| Menominee | 79.3 /100 | #149 | Good 86.3% |
| Immigrants | Western Asia | 78.8 /100 | #150 | Good 86.3% |
| Immigrants | Bosnia and Herzegovina | 77.9 /100 | #151 | Good 86.3% |
| Brazilians | 77.2 /100 | #152 | Good 86.3% |
| Kenyans | 76.6 /100 | #153 | Good 86.3% |