Liberian vs Immigrants from Micronesia College, Under 1 year
COMPARE
Liberian
Immigrants from Micronesia
College, Under 1 year
College, Under 1 year Comparison
Liberians
Immigrants from Micronesia
63.0%
COLLEGE, UNDER 1 YEAR
3.2/ 100
METRIC RATING
229th/ 347
METRIC RANK
61.5%
COLLEGE, UNDER 1 YEAR
0.5/ 100
METRIC RATING
251st/ 347
METRIC RANK
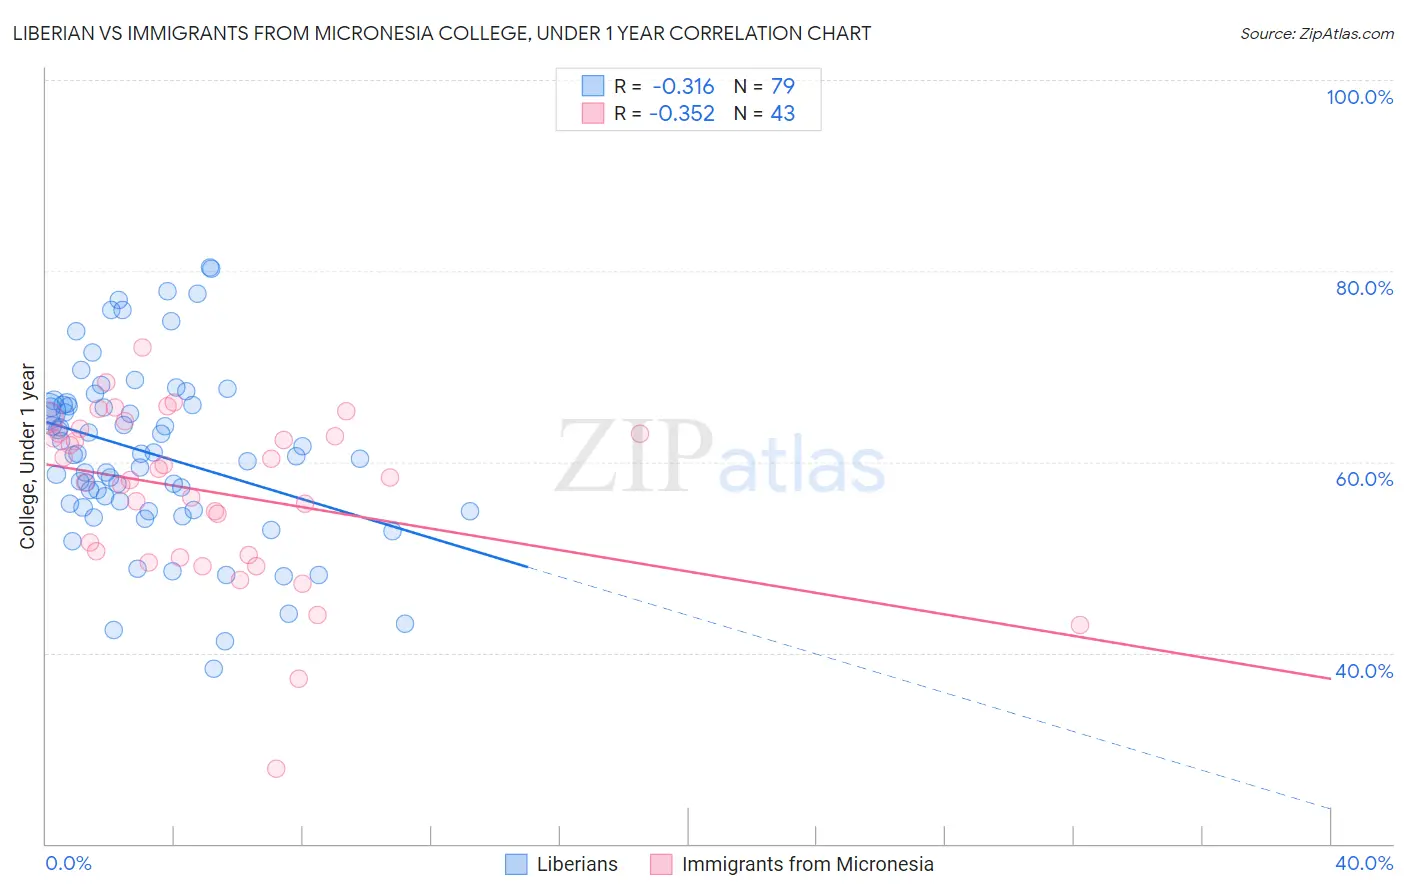
Liberian vs Immigrants from Micronesia College, Under 1 year Correlation Chart
The statistical analysis conducted on geographies consisting of 118,090,659 people shows a mild negative correlation between the proportion of Liberians and percentage of population with at least college, under 1 year education in the United States with a correlation coefficient (R) of -0.316 and weighted average of 63.0%. Similarly, the statistical analysis conducted on geographies consisting of 61,608,832 people shows a mild negative correlation between the proportion of Immigrants from Micronesia and percentage of population with at least college, under 1 year education in the United States with a correlation coefficient (R) of -0.352 and weighted average of 61.5%, a difference of 2.3%.
College, Under 1 year Correlation Summary
| Measurement | Liberian | Immigrants from Micronesia |
| Minimum | 38.3% | 27.9% |
| Maximum | 80.3% | 72.0% |
| Range | 42.0% | 44.1% |
| Mean | 60.9% | 56.9% |
| Median | 60.8% | 58.3% |
| Interquartile 25% (IQ1) | 55.2% | 50.3% |
| Interquartile 75% (IQ3) | 66.0% | 63.0% |
| Interquartile Range (IQR) | 10.8% | 12.7% |
| Standard Deviation (Sample) | 9.1% | 8.8% |
| Standard Deviation (Population) | 9.0% | 8.7% |
Similar Demographics by College, Under 1 year
Demographics Similar to Liberians by College, Under 1 year
In terms of college, under 1 year, the demographic groups most similar to Liberians are Samoan (63.0%, a difference of 0.050%), Nonimmigrants (62.9%, a difference of 0.070%), Immigrants from Ghana (63.1%, a difference of 0.17%), Immigrants from Colombia (63.1%, a difference of 0.26%), and Immigrants from Peru (63.1%, a difference of 0.27%).
| Demographics | Rating | Rank | College, Under 1 year |
| Immigrants | Senegal | 5.0 /100 | #222 | Tragic 63.3% |
| Immigrants | Costa Rica | 4.5 /100 | #223 | Tragic 63.2% |
| Sub-Saharan Africans | 4.4 /100 | #224 | Tragic 63.2% |
| Immigrants | Peru | 4.0 /100 | #225 | Tragic 63.1% |
| Immigrants | Colombia | 4.0 /100 | #226 | Tragic 63.1% |
| Immigrants | Ghana | 3.7 /100 | #227 | Tragic 63.1% |
| Samoans | 3.3 /100 | #228 | Tragic 63.0% |
| Liberians | 3.2 /100 | #229 | Tragic 63.0% |
| Immigrants | Nonimmigrants | 3.0 /100 | #230 | Tragic 62.9% |
| Immigrants | Western Africa | 2.4 /100 | #231 | Tragic 62.8% |
| Osage | 2.2 /100 | #232 | Tragic 62.7% |
| Iroquois | 2.0 /100 | #233 | Tragic 62.6% |
| Chippewa | 2.0 /100 | #234 | Tragic 62.6% |
| Spanish Americans | 1.9 /100 | #235 | Tragic 62.6% |
| Immigrants | Immigrants | 1.7 /100 | #236 | Tragic 62.5% |
Demographics Similar to Immigrants from Micronesia by College, Under 1 year
In terms of college, under 1 year, the demographic groups most similar to Immigrants from Micronesia are West Indian (61.5%, a difference of 0.11%), Japanese (61.5%, a difference of 0.11%), Immigrants from Cambodia (61.5%, a difference of 0.11%), Vietnamese (61.7%, a difference of 0.19%), and Immigrants from Congo (61.7%, a difference of 0.19%).
| Demographics | Rating | Rank | College, Under 1 year |
| Colville | 1.0 /100 | #244 | Tragic 62.1% |
| Delaware | 0.9 /100 | #245 | Tragic 62.1% |
| Marshallese | 0.8 /100 | #246 | Tragic 61.9% |
| Immigrants | Liberia | 0.8 /100 | #247 | Tragic 61.9% |
| Potawatomi | 0.6 /100 | #248 | Tragic 61.8% |
| Vietnamese | 0.5 /100 | #249 | Tragic 61.7% |
| Immigrants | Congo | 0.5 /100 | #250 | Tragic 61.7% |
| Immigrants | Micronesia | 0.5 /100 | #251 | Tragic 61.5% |
| West Indians | 0.4 /100 | #252 | Tragic 61.5% |
| Japanese | 0.4 /100 | #253 | Tragic 61.5% |
| Immigrants | Cambodia | 0.4 /100 | #254 | Tragic 61.5% |
| Comanche | 0.4 /100 | #255 | Tragic 61.4% |
| Bangladeshis | 0.4 /100 | #256 | Tragic 61.4% |
| Immigrants | Laos | 0.3 /100 | #257 | Tragic 61.3% |
| Immigrants | Bangladesh | 0.3 /100 | #258 | Tragic 61.3% |