Liberian vs Crow College, Under 1 year
COMPARE
Liberian
Crow
College, Under 1 year
College, Under 1 year Comparison
Liberians
Crow
63.0%
COLLEGE, UNDER 1 YEAR
3.2/ 100
METRIC RATING
229th/ 347
METRIC RANK
60.2%
COLLEGE, UNDER 1 YEAR
0.1/ 100
METRIC RATING
280th/ 347
METRIC RANK
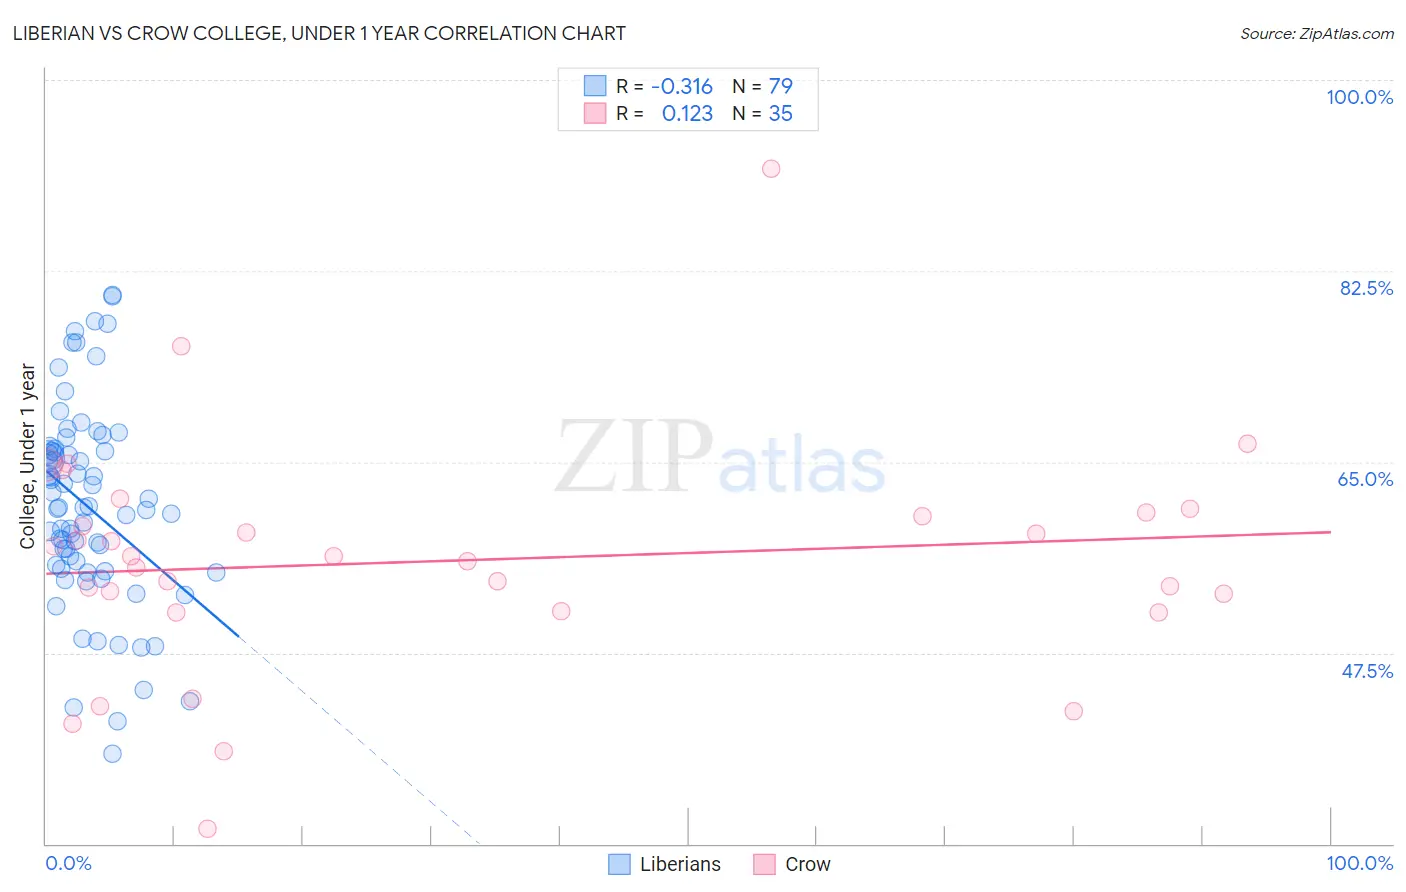
Liberian vs Crow College, Under 1 year Correlation Chart
The statistical analysis conducted on geographies consisting of 118,090,659 people shows a mild negative correlation between the proportion of Liberians and percentage of population with at least college, under 1 year education in the United States with a correlation coefficient (R) of -0.316 and weighted average of 63.0%. Similarly, the statistical analysis conducted on geographies consisting of 59,209,940 people shows a poor positive correlation between the proportion of Crow and percentage of population with at least college, under 1 year education in the United States with a correlation coefficient (R) of 0.123 and weighted average of 60.2%, a difference of 4.6%.
College, Under 1 year Correlation Summary
| Measurement | Liberian | Crow |
| Minimum | 38.3% | 31.4% |
| Maximum | 80.3% | 91.8% |
| Range | 42.0% | 60.4% |
| Mean | 60.9% | 55.9% |
| Median | 60.8% | 56.3% |
| Interquartile 25% (IQ1) | 55.2% | 51.3% |
| Interquartile 75% (IQ3) | 66.0% | 60.3% |
| Interquartile Range (IQR) | 10.8% | 9.1% |
| Standard Deviation (Sample) | 9.1% | 10.7% |
| Standard Deviation (Population) | 9.0% | 10.6% |
Similar Demographics by College, Under 1 year
Demographics Similar to Liberians by College, Under 1 year
In terms of college, under 1 year, the demographic groups most similar to Liberians are Samoan (63.0%, a difference of 0.050%), Nonimmigrants (62.9%, a difference of 0.070%), Immigrants from Ghana (63.1%, a difference of 0.17%), Immigrants from Colombia (63.1%, a difference of 0.26%), and Immigrants from Peru (63.1%, a difference of 0.27%).
| Demographics | Rating | Rank | College, Under 1 year |
| Immigrants | Senegal | 5.0 /100 | #222 | Tragic 63.3% |
| Immigrants | Costa Rica | 4.5 /100 | #223 | Tragic 63.2% |
| Sub-Saharan Africans | 4.4 /100 | #224 | Tragic 63.2% |
| Immigrants | Peru | 4.0 /100 | #225 | Tragic 63.1% |
| Immigrants | Colombia | 4.0 /100 | #226 | Tragic 63.1% |
| Immigrants | Ghana | 3.7 /100 | #227 | Tragic 63.1% |
| Samoans | 3.3 /100 | #228 | Tragic 63.0% |
| Liberians | 3.2 /100 | #229 | Tragic 63.0% |
| Immigrants | Nonimmigrants | 3.0 /100 | #230 | Tragic 62.9% |
| Immigrants | Western Africa | 2.4 /100 | #231 | Tragic 62.8% |
| Osage | 2.2 /100 | #232 | Tragic 62.7% |
| Iroquois | 2.0 /100 | #233 | Tragic 62.6% |
| Chippewa | 2.0 /100 | #234 | Tragic 62.6% |
| Spanish Americans | 1.9 /100 | #235 | Tragic 62.6% |
| Immigrants | Immigrants | 1.7 /100 | #236 | Tragic 62.5% |
Demographics Similar to Crow by College, Under 1 year
In terms of college, under 1 year, the demographic groups most similar to Crow are Ute (60.2%, a difference of 0.090%), Yaqui (60.2%, a difference of 0.10%), Cherokee (60.1%, a difference of 0.11%), Bahamian (60.3%, a difference of 0.14%), and Belizean (60.1%, a difference of 0.16%).
| Demographics | Rating | Rank | College, Under 1 year |
| Chickasaw | 0.1 /100 | #273 | Tragic 60.4% |
| Alaska Natives | 0.1 /100 | #274 | Tragic 60.4% |
| Immigrants | Barbados | 0.1 /100 | #275 | Tragic 60.4% |
| Arapaho | 0.1 /100 | #276 | Tragic 60.3% |
| Bahamians | 0.1 /100 | #277 | Tragic 60.3% |
| Yaqui | 0.1 /100 | #278 | Tragic 60.2% |
| Ute | 0.1 /100 | #279 | Tragic 60.2% |
| Crow | 0.1 /100 | #280 | Tragic 60.2% |
| Cherokee | 0.1 /100 | #281 | Tragic 60.1% |
| Belizeans | 0.1 /100 | #282 | Tragic 60.1% |
| Immigrants | Jamaica | 0.0 /100 | #283 | Tragic 59.7% |
| Immigrants | St. Vincent and the Grenadines | 0.0 /100 | #284 | Tragic 59.6% |
| Paiute | 0.0 /100 | #285 | Tragic 59.6% |
| British West Indians | 0.0 /100 | #286 | Tragic 59.5% |
| Sioux | 0.0 /100 | #287 | Tragic 59.4% |