Liberian vs Cheyenne 1st Grade
COMPARE
Liberian
Cheyenne
1st Grade
1st Grade Comparison
Liberians
Cheyenne
97.6%
1ST GRADE
1.4/ 100
METRIC RATING
241st/ 347
METRIC RANK
98.3%
1ST GRADE
99.6/ 100
METRIC RATING
72nd/ 347
METRIC RANK
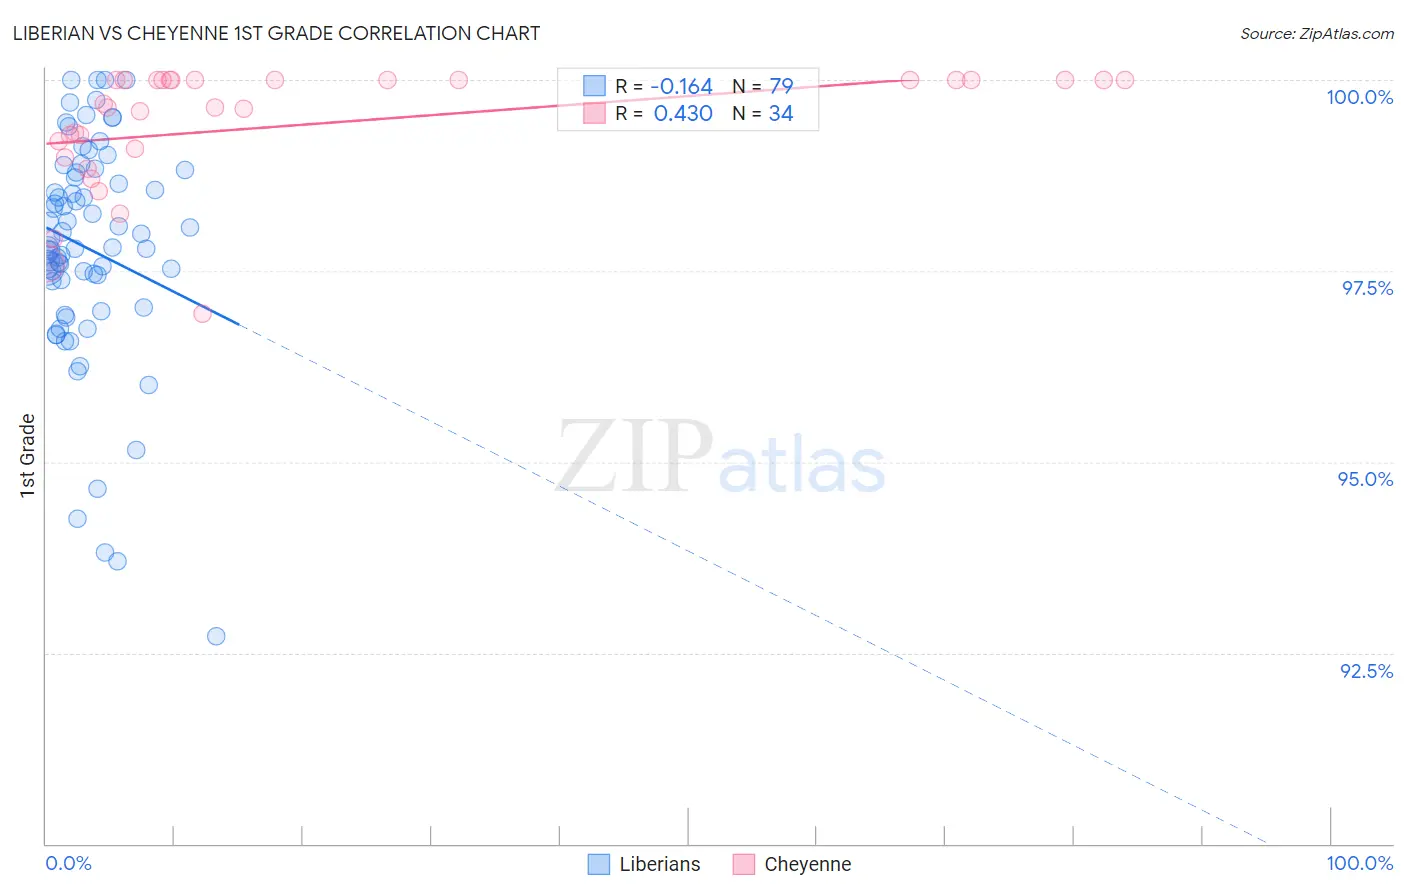
Liberian vs Cheyenne 1st Grade Correlation Chart
The statistical analysis conducted on geographies consisting of 118,100,194 people shows a poor negative correlation between the proportion of Liberians and percentage of population with at least 1st grade education in the United States with a correlation coefficient (R) of -0.164 and weighted average of 97.6%. Similarly, the statistical analysis conducted on geographies consisting of 80,719,411 people shows a moderate positive correlation between the proportion of Cheyenne and percentage of population with at least 1st grade education in the United States with a correlation coefficient (R) of 0.430 and weighted average of 98.3%, a difference of 0.75%.
1st Grade Correlation Summary
| Measurement | Liberian | Cheyenne |
| Minimum | 92.7% | 96.9% |
| Maximum | 100.0% | 100.0% |
| Range | 7.3% | 3.1% |
| Mean | 97.8% | 99.4% |
| Median | 97.8% | 99.7% |
| Interquartile 25% (IQ1) | 97.4% | 99.1% |
| Interquartile 75% (IQ3) | 98.8% | 100.0% |
| Interquartile Range (IQR) | 1.4% | 0.90% |
| Standard Deviation (Sample) | 1.5% | 0.79% |
| Standard Deviation (Population) | 1.5% | 0.78% |
Similar Demographics by 1st Grade
Demographics Similar to Liberians by 1st Grade
In terms of 1st grade, the demographic groups most similar to Liberians are Korean (97.6%, a difference of 0.0%), Immigrants from Eastern Asia (97.6%, a difference of 0.010%), Immigrants from Indonesia (97.6%, a difference of 0.010%), Bolivian (97.6%, a difference of 0.010%), and U.S. Virgin Islander (97.6%, a difference of 0.020%).
| Demographics | Rating | Rank | 1st Grade |
| Colombians | 2.2 /100 | #234 | Tragic 97.6% |
| Immigrants | Malaysia | 2.1 /100 | #235 | Tragic 97.6% |
| Immigrants | Western Asia | 2.1 /100 | #236 | Tragic 97.6% |
| U.S. Virgin Islanders | 1.9 /100 | #237 | Tragic 97.6% |
| Nigerians | 1.8 /100 | #238 | Tragic 97.6% |
| Immigrants | Eastern Asia | 1.6 /100 | #239 | Tragic 97.6% |
| Koreans | 1.5 /100 | #240 | Tragic 97.6% |
| Liberians | 1.4 /100 | #241 | Tragic 97.6% |
| Immigrants | Indonesia | 1.2 /100 | #242 | Tragic 97.6% |
| Bolivians | 1.2 /100 | #243 | Tragic 97.6% |
| Asians | 1.1 /100 | #244 | Tragic 97.6% |
| South Americans | 1.1 /100 | #245 | Tragic 97.6% |
| Immigrants | Eastern Africa | 1.0 /100 | #246 | Tragic 97.6% |
| Peruvians | 1.0 /100 | #247 | Tragic 97.6% |
| Immigrants | Middle Africa | 1.0 /100 | #248 | Tragic 97.6% |
Demographics Similar to Cheyenne by 1st Grade
In terms of 1st grade, the demographic groups most similar to Cheyenne are Canadian (98.3%, a difference of 0.010%), Immigrants from Austria (98.3%, a difference of 0.010%), Immigrants from Northern Europe (98.3%, a difference of 0.010%), Chickasaw (98.3%, a difference of 0.010%), and Russian (98.3%, a difference of 0.010%).
| Demographics | Rating | Rank | 1st Grade |
| Maltese | 99.7 /100 | #65 | Exceptional 98.4% |
| Canadians | 99.6 /100 | #66 | Exceptional 98.3% |
| Immigrants | Austria | 99.6 /100 | #67 | Exceptional 98.3% |
| Immigrants | Northern Europe | 99.6 /100 | #68 | Exceptional 98.3% |
| Chickasaw | 99.6 /100 | #69 | Exceptional 98.3% |
| Russians | 99.6 /100 | #70 | Exceptional 98.3% |
| Serbians | 99.6 /100 | #71 | Exceptional 98.3% |
| Cheyenne | 99.6 /100 | #72 | Exceptional 98.3% |
| Cajuns | 99.5 /100 | #73 | Exceptional 98.3% |
| Immigrants | Netherlands | 99.4 /100 | #74 | Exceptional 98.3% |
| Cherokee | 99.3 /100 | #75 | Exceptional 98.3% |
| Shoshone | 99.3 /100 | #76 | Exceptional 98.3% |
| Immigrants | England | 99.3 /100 | #77 | Exceptional 98.3% |
| Immigrants | Belgium | 99.2 /100 | #78 | Exceptional 98.3% |
| Immigrants | Lithuania | 99.2 /100 | #79 | Exceptional 98.3% |