Liberian vs Moroccan College, Under 1 year
COMPARE
Liberian
Moroccan
College, Under 1 year
College, Under 1 year Comparison
Liberians
Moroccans
63.0%
COLLEGE, UNDER 1 YEAR
3.2/ 100
METRIC RATING
229th/ 347
METRIC RANK
65.6%
COLLEGE, UNDER 1 YEAR
56.7/ 100
METRIC RATING
166th/ 347
METRIC RANK
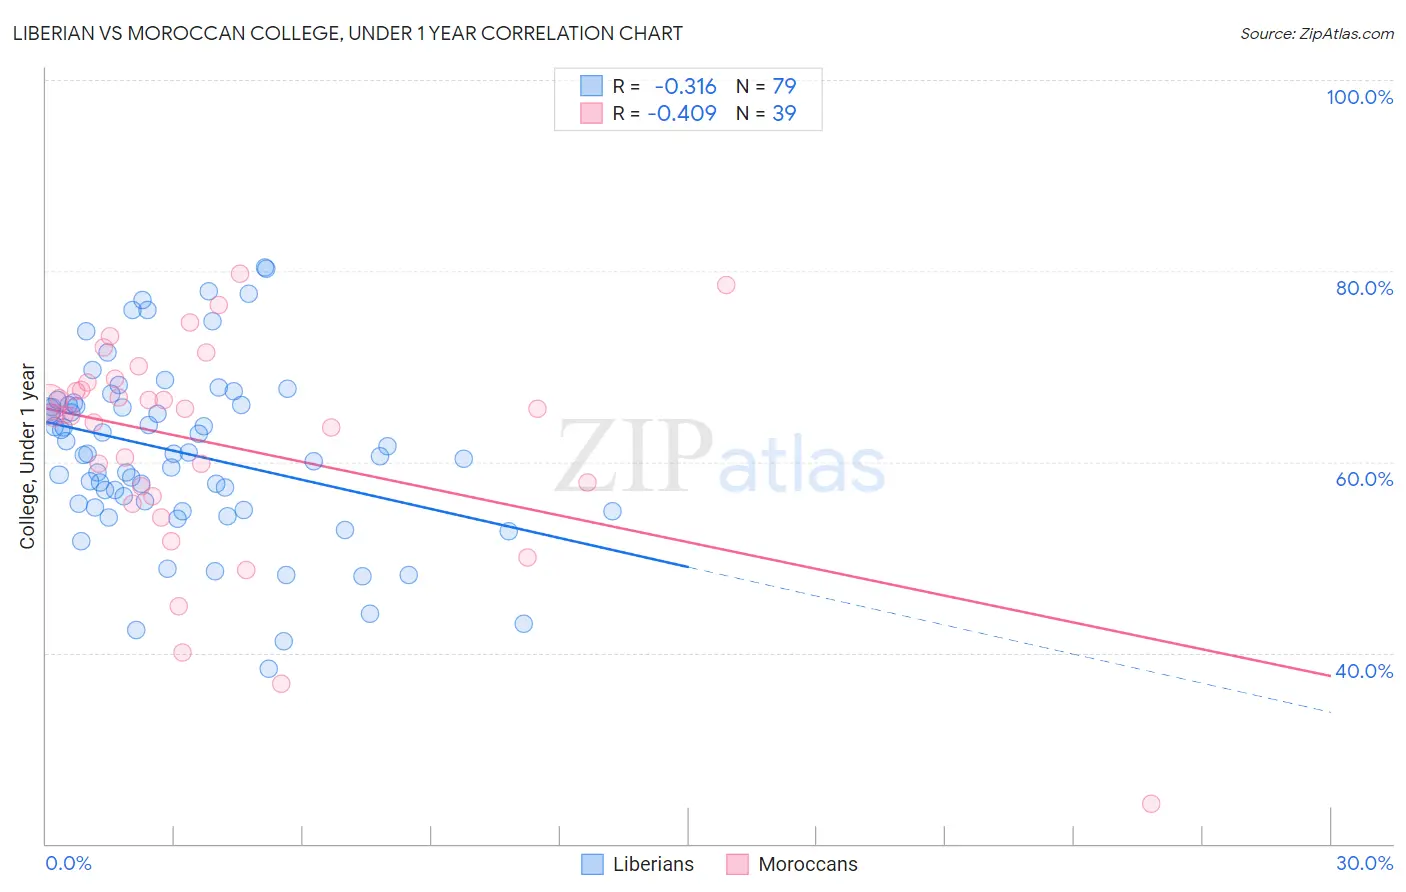
Liberian vs Moroccan College, Under 1 year Correlation Chart
The statistical analysis conducted on geographies consisting of 118,090,659 people shows a mild negative correlation between the proportion of Liberians and percentage of population with at least college, under 1 year education in the United States with a correlation coefficient (R) of -0.316 and weighted average of 63.0%. Similarly, the statistical analysis conducted on geographies consisting of 201,817,667 people shows a moderate negative correlation between the proportion of Moroccans and percentage of population with at least college, under 1 year education in the United States with a correlation coefficient (R) of -0.409 and weighted average of 65.6%, a difference of 4.2%.
College, Under 1 year Correlation Summary
| Measurement | Liberian | Moroccan |
| Minimum | 38.3% | 24.2% |
| Maximum | 80.3% | 79.7% |
| Range | 42.0% | 55.5% |
| Mean | 60.9% | 61.8% |
| Median | 60.8% | 64.9% |
| Interquartile 25% (IQ1) | 55.2% | 56.5% |
| Interquartile 75% (IQ3) | 66.0% | 68.4% |
| Interquartile Range (IQR) | 10.8% | 11.9% |
| Standard Deviation (Sample) | 9.1% | 11.6% |
| Standard Deviation (Population) | 9.0% | 11.4% |
Similar Demographics by College, Under 1 year
Demographics Similar to Liberians by College, Under 1 year
In terms of college, under 1 year, the demographic groups most similar to Liberians are Samoan (63.0%, a difference of 0.050%), Nonimmigrants (62.9%, a difference of 0.070%), Immigrants from Ghana (63.1%, a difference of 0.17%), Immigrants from Colombia (63.1%, a difference of 0.26%), and Immigrants from Peru (63.1%, a difference of 0.27%).
| Demographics | Rating | Rank | College, Under 1 year |
| Immigrants | Senegal | 5.0 /100 | #222 | Tragic 63.3% |
| Immigrants | Costa Rica | 4.5 /100 | #223 | Tragic 63.2% |
| Sub-Saharan Africans | 4.4 /100 | #224 | Tragic 63.2% |
| Immigrants | Peru | 4.0 /100 | #225 | Tragic 63.1% |
| Immigrants | Colombia | 4.0 /100 | #226 | Tragic 63.1% |
| Immigrants | Ghana | 3.7 /100 | #227 | Tragic 63.1% |
| Samoans | 3.3 /100 | #228 | Tragic 63.0% |
| Liberians | 3.2 /100 | #229 | Tragic 63.0% |
| Immigrants | Nonimmigrants | 3.0 /100 | #230 | Tragic 62.9% |
| Immigrants | Western Africa | 2.4 /100 | #231 | Tragic 62.8% |
| Osage | 2.2 /100 | #232 | Tragic 62.7% |
| Iroquois | 2.0 /100 | #233 | Tragic 62.6% |
| Chippewa | 2.0 /100 | #234 | Tragic 62.6% |
| Spanish Americans | 1.9 /100 | #235 | Tragic 62.6% |
| Immigrants | Immigrants | 1.7 /100 | #236 | Tragic 62.5% |
Demographics Similar to Moroccans by College, Under 1 year
In terms of college, under 1 year, the demographic groups most similar to Moroccans are Immigrants from Somalia (65.6%, a difference of 0.010%), Hungarian (65.6%, a difference of 0.030%), Yugoslavian (65.6%, a difference of 0.040%), German (65.6%, a difference of 0.040%), and Immigrants from Oceania (65.6%, a difference of 0.080%).
| Demographics | Rating | Rank | College, Under 1 year |
| Tlingit-Haida | 66.4 /100 | #159 | Good 65.9% |
| Albanians | 66.1 /100 | #160 | Good 65.9% |
| Brazilians | 66.0 /100 | #161 | Good 65.9% |
| Koreans | 65.3 /100 | #162 | Good 65.9% |
| Somalis | 62.7 /100 | #163 | Good 65.8% |
| Czechoslovakians | 62.6 /100 | #164 | Good 65.8% |
| Immigrants | Uzbekistan | 61.6 /100 | #165 | Good 65.8% |
| Moroccans | 56.7 /100 | #166 | Average 65.6% |
| Immigrants | Somalia | 56.4 /100 | #167 | Average 65.6% |
| Hungarians | 55.9 /100 | #168 | Average 65.6% |
| Yugoslavians | 55.7 /100 | #169 | Average 65.6% |
| Germans | 55.7 /100 | #170 | Average 65.6% |
| Immigrants | Oceania | 55.0 /100 | #171 | Average 65.6% |
| South American Indians | 54.4 /100 | #172 | Average 65.5% |
| Swiss | 53.9 /100 | #173 | Average 65.5% |