Korean vs Austrian Bachelor's Degree
COMPARE
Korean
Austrian
Bachelor's Degree
Bachelor's Degree Comparison
Koreans
Austrians
37.0%
BACHELOR'S DEGREE
29.8/ 100
METRIC RATING
195th/ 347
METRIC RANK
40.6%
BACHELOR'S DEGREE
95.5/ 100
METRIC RATING
117th/ 347
METRIC RANK
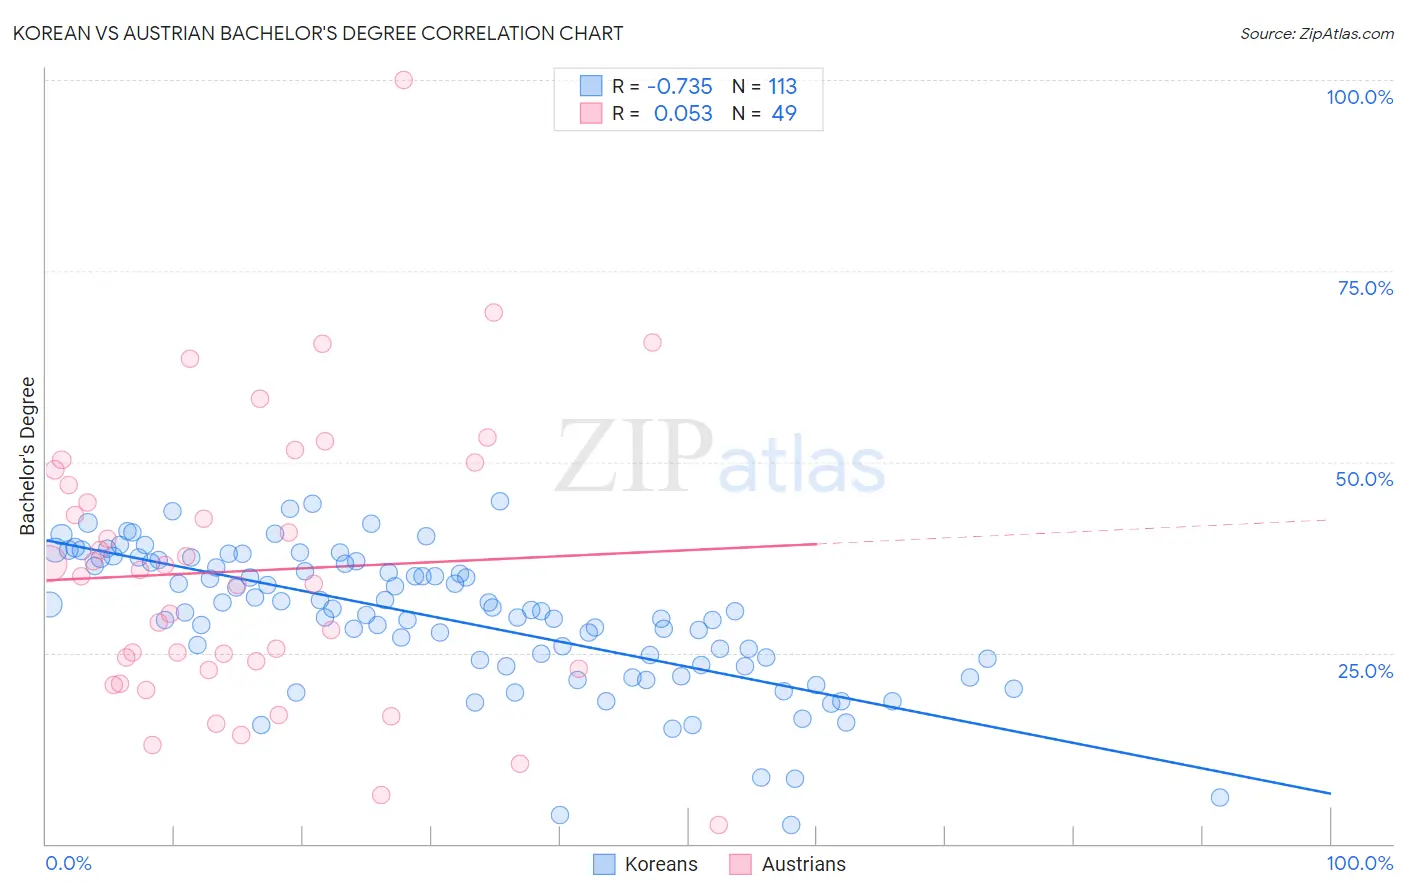
Korean vs Austrian Bachelor's Degree Correlation Chart
The statistical analysis conducted on geographies consisting of 510,872,242 people shows a strong negative correlation between the proportion of Koreans and percentage of population with at least bachelor's degree education in the United States with a correlation coefficient (R) of -0.735 and weighted average of 37.0%. Similarly, the statistical analysis conducted on geographies consisting of 452,047,267 people shows a slight positive correlation between the proportion of Austrians and percentage of population with at least bachelor's degree education in the United States with a correlation coefficient (R) of 0.053 and weighted average of 40.6%, a difference of 9.7%.
Bachelor's Degree Correlation Summary
| Measurement | Korean | Austrian |
| Minimum | 2.5% | 2.4% |
| Maximum | 44.8% | 100.0% |
| Range | 42.3% | 97.6% |
| Mean | 29.6% | 35.7% |
| Median | 30.4% | 35.1% |
| Interquartile 25% (IQ1) | 23.7% | 22.9% |
| Interquartile 75% (IQ3) | 36.9% | 48.0% |
| Interquartile Range (IQR) | 13.2% | 25.1% |
| Standard Deviation (Sample) | 9.0% | 18.7% |
| Standard Deviation (Population) | 9.0% | 18.5% |
Similar Demographics by Bachelor's Degree
Demographics Similar to Koreans by Bachelor's Degree
In terms of bachelor's degree, the demographic groups most similar to Koreans are Belgian (37.0%, a difference of 0.010%), Celtic (37.0%, a difference of 0.030%), Czechoslovakian (37.0%, a difference of 0.070%), Welsh (37.0%, a difference of 0.080%), and Yugoslavian (37.1%, a difference of 0.20%).
| Demographics | Rating | Rank | Bachelor's Degree |
| Immigrants | Oceania | 37.3 /100 | #188 | Fair 37.3% |
| Slovaks | 36.9 /100 | #189 | Fair 37.3% |
| Swiss | 34.1 /100 | #190 | Fair 37.2% |
| Nigerians | 33.9 /100 | #191 | Fair 37.2% |
| Immigrants | Vietnam | 32.1 /100 | #192 | Fair 37.1% |
| Yugoslavians | 31.5 /100 | #193 | Fair 37.1% |
| Belgians | 29.9 /100 | #194 | Fair 37.0% |
| Koreans | 29.8 /100 | #195 | Fair 37.0% |
| Celtics | 29.5 /100 | #196 | Fair 37.0% |
| Czechoslovakians | 29.2 /100 | #197 | Fair 37.0% |
| Welsh | 29.1 /100 | #198 | Fair 37.0% |
| Immigrants | Costa Rica | 27.4 /100 | #199 | Fair 36.9% |
| Immigrants | Ghana | 27.4 /100 | #200 | Fair 36.9% |
| Immigrants | South Eastern Asia | 25.4 /100 | #201 | Fair 36.8% |
| Immigrants | Zaire | 25.3 /100 | #202 | Fair 36.8% |
Demographics Similar to Austrians by Bachelor's Degree
In terms of bachelor's degree, the demographic groups most similar to Austrians are Croatian (40.6%, a difference of 0.020%), Immigrants from Uganda (40.7%, a difference of 0.10%), Palestinian (40.7%, a difference of 0.15%), Immigrants from Syria (40.5%, a difference of 0.34%), and Afghan (40.8%, a difference of 0.39%).
| Demographics | Rating | Rank | Bachelor's Degree |
| Albanians | 96.5 /100 | #110 | Exceptional 40.9% |
| Immigrants | Chile | 96.4 /100 | #111 | Exceptional 40.8% |
| Ugandans | 96.3 /100 | #112 | Exceptional 40.8% |
| Brazilians | 96.3 /100 | #113 | Exceptional 40.8% |
| Afghans | 96.2 /100 | #114 | Exceptional 40.8% |
| Palestinians | 95.8 /100 | #115 | Exceptional 40.7% |
| Immigrants | Uganda | 95.7 /100 | #116 | Exceptional 40.7% |
| Austrians | 95.5 /100 | #117 | Exceptional 40.6% |
| Croatians | 95.5 /100 | #118 | Exceptional 40.6% |
| Immigrants | Syria | 94.9 /100 | #119 | Exceptional 40.5% |
| Venezuelans | 94.7 /100 | #120 | Exceptional 40.5% |
| Moroccans | 94.6 /100 | #121 | Exceptional 40.5% |
| Immigrants | Albania | 94.4 /100 | #122 | Exceptional 40.4% |
| Lebanese | 94.3 /100 | #123 | Exceptional 40.4% |
| Immigrants | Eritrea | 94.3 /100 | #124 | Exceptional 40.4% |