Korean vs Spanish Bachelor's Degree
COMPARE
Korean
Spanish
Bachelor's Degree
Bachelor's Degree Comparison
Koreans
Spanish
37.0%
BACHELOR'S DEGREE
29.8/ 100
METRIC RATING
195th/ 347
METRIC RANK
35.8%
BACHELOR'S DEGREE
9.6/ 100
METRIC RATING
220th/ 347
METRIC RANK
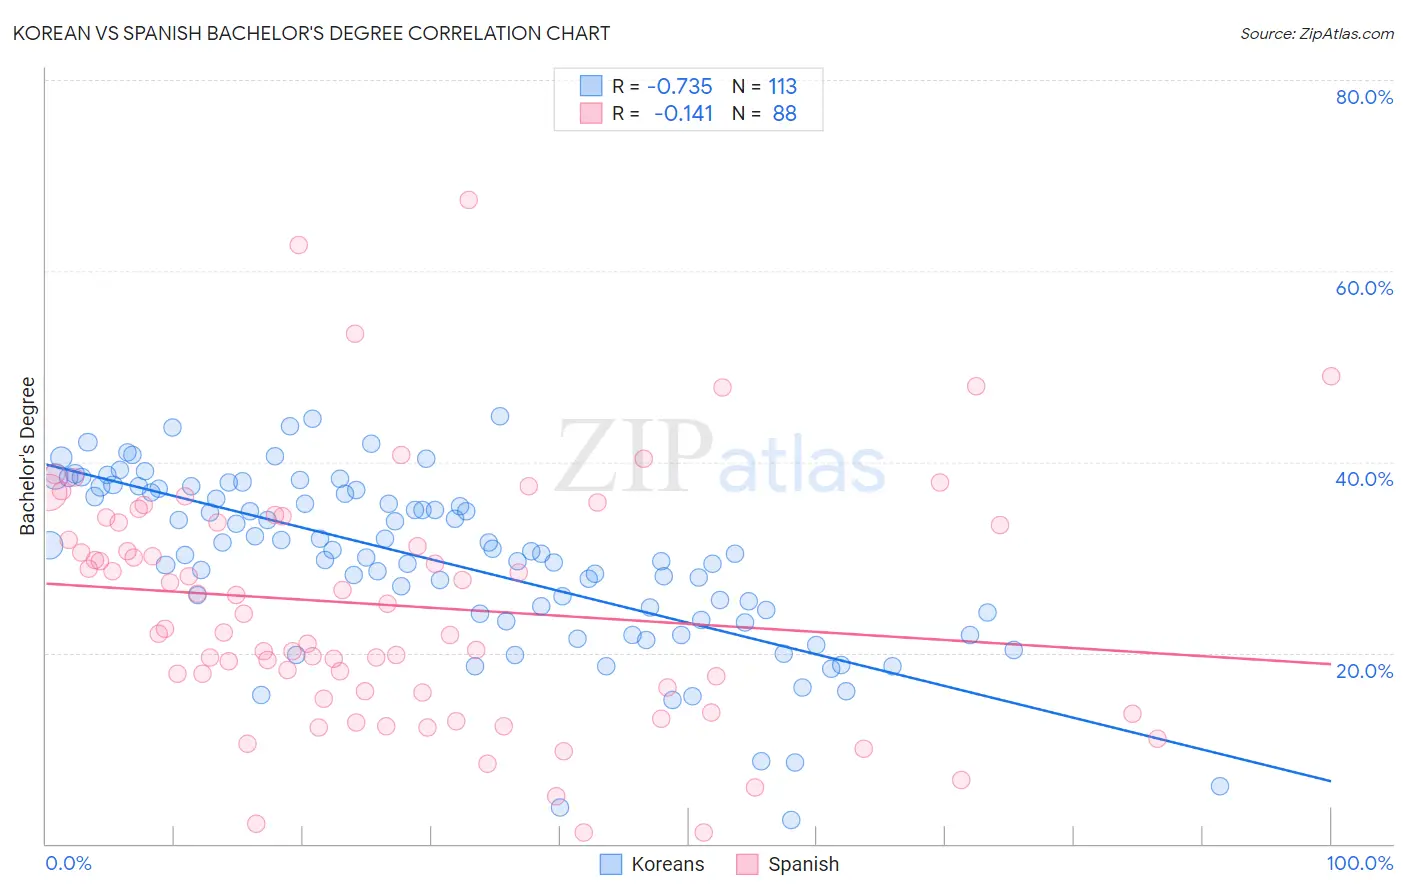
Korean vs Spanish Bachelor's Degree Correlation Chart
The statistical analysis conducted on geographies consisting of 510,872,242 people shows a strong negative correlation between the proportion of Koreans and percentage of population with at least bachelor's degree education in the United States with a correlation coefficient (R) of -0.735 and weighted average of 37.0%. Similarly, the statistical analysis conducted on geographies consisting of 422,162,490 people shows a poor negative correlation between the proportion of Spanish and percentage of population with at least bachelor's degree education in the United States with a correlation coefficient (R) of -0.141 and weighted average of 35.8%, a difference of 3.6%.
Bachelor's Degree Correlation Summary
| Measurement | Korean | Spanish |
| Minimum | 2.5% | 1.1% |
| Maximum | 44.8% | 67.4% |
| Range | 42.3% | 66.3% |
| Mean | 29.6% | 25.0% |
| Median | 30.4% | 23.3% |
| Interquartile 25% (IQ1) | 23.7% | 15.9% |
| Interquartile 75% (IQ3) | 36.9% | 33.6% |
| Interquartile Range (IQR) | 13.2% | 17.8% |
| Standard Deviation (Sample) | 9.0% | 12.9% |
| Standard Deviation (Population) | 9.0% | 12.9% |
Similar Demographics by Bachelor's Degree
Demographics Similar to Koreans by Bachelor's Degree
In terms of bachelor's degree, the demographic groups most similar to Koreans are Belgian (37.0%, a difference of 0.010%), Celtic (37.0%, a difference of 0.030%), Czechoslovakian (37.0%, a difference of 0.070%), Welsh (37.0%, a difference of 0.080%), and Yugoslavian (37.1%, a difference of 0.20%).
| Demographics | Rating | Rank | Bachelor's Degree |
| Immigrants | Oceania | 37.3 /100 | #188 | Fair 37.3% |
| Slovaks | 36.9 /100 | #189 | Fair 37.3% |
| Swiss | 34.1 /100 | #190 | Fair 37.2% |
| Nigerians | 33.9 /100 | #191 | Fair 37.2% |
| Immigrants | Vietnam | 32.1 /100 | #192 | Fair 37.1% |
| Yugoslavians | 31.5 /100 | #193 | Fair 37.1% |
| Belgians | 29.9 /100 | #194 | Fair 37.0% |
| Koreans | 29.8 /100 | #195 | Fair 37.0% |
| Celtics | 29.5 /100 | #196 | Fair 37.0% |
| Czechoslovakians | 29.2 /100 | #197 | Fair 37.0% |
| Welsh | 29.1 /100 | #198 | Fair 37.0% |
| Immigrants | Costa Rica | 27.4 /100 | #199 | Fair 36.9% |
| Immigrants | Ghana | 27.4 /100 | #200 | Fair 36.9% |
| Immigrants | South Eastern Asia | 25.4 /100 | #201 | Fair 36.8% |
| Immigrants | Zaire | 25.3 /100 | #202 | Fair 36.8% |
Demographics Similar to Spanish by Bachelor's Degree
In terms of bachelor's degree, the demographic groups most similar to Spanish are West Indian (35.8%, a difference of 0.040%), Subsaharan African (35.8%, a difference of 0.070%), Dutch (35.7%, a difference of 0.11%), German Russian (35.8%, a difference of 0.17%), and Trinidadian and Tobagonian (35.7%, a difference of 0.25%).
| Demographics | Rating | Rank | Bachelor's Degree |
| Immigrants | Panama | 14.2 /100 | #213 | Poor 36.2% |
| Germans | 13.9 /100 | #214 | Poor 36.1% |
| Immigrants | Western Africa | 13.8 /100 | #215 | Poor 36.1% |
| Barbadians | 13.5 /100 | #216 | Poor 36.1% |
| German Russians | 10.2 /100 | #217 | Poor 35.8% |
| Sub-Saharan Africans | 9.8 /100 | #218 | Tragic 35.8% |
| West Indians | 9.7 /100 | #219 | Tragic 35.8% |
| Spanish | 9.6 /100 | #220 | Tragic 35.8% |
| Dutch | 9.2 /100 | #221 | Tragic 35.7% |
| Trinidadians and Tobagonians | 8.8 /100 | #222 | Tragic 35.7% |
| French Canadians | 8.3 /100 | #223 | Tragic 35.6% |
| Immigrants | Barbados | 7.5 /100 | #224 | Tragic 35.5% |
| Immigrants | Burma/Myanmar | 7.3 /100 | #225 | Tragic 35.5% |
| Portuguese | 7.2 /100 | #226 | Tragic 35.5% |
| Ecuadorians | 6.6 /100 | #227 | Tragic 35.4% |