Korean vs Cheyenne Bachelor's Degree
COMPARE
Korean
Cheyenne
Bachelor's Degree
Bachelor's Degree Comparison
Koreans
Cheyenne
37.0%
BACHELOR'S DEGREE
29.8/ 100
METRIC RATING
195th/ 347
METRIC RANK
29.4%
BACHELOR'S DEGREE
0.0/ 100
METRIC RATING
310th/ 347
METRIC RANK
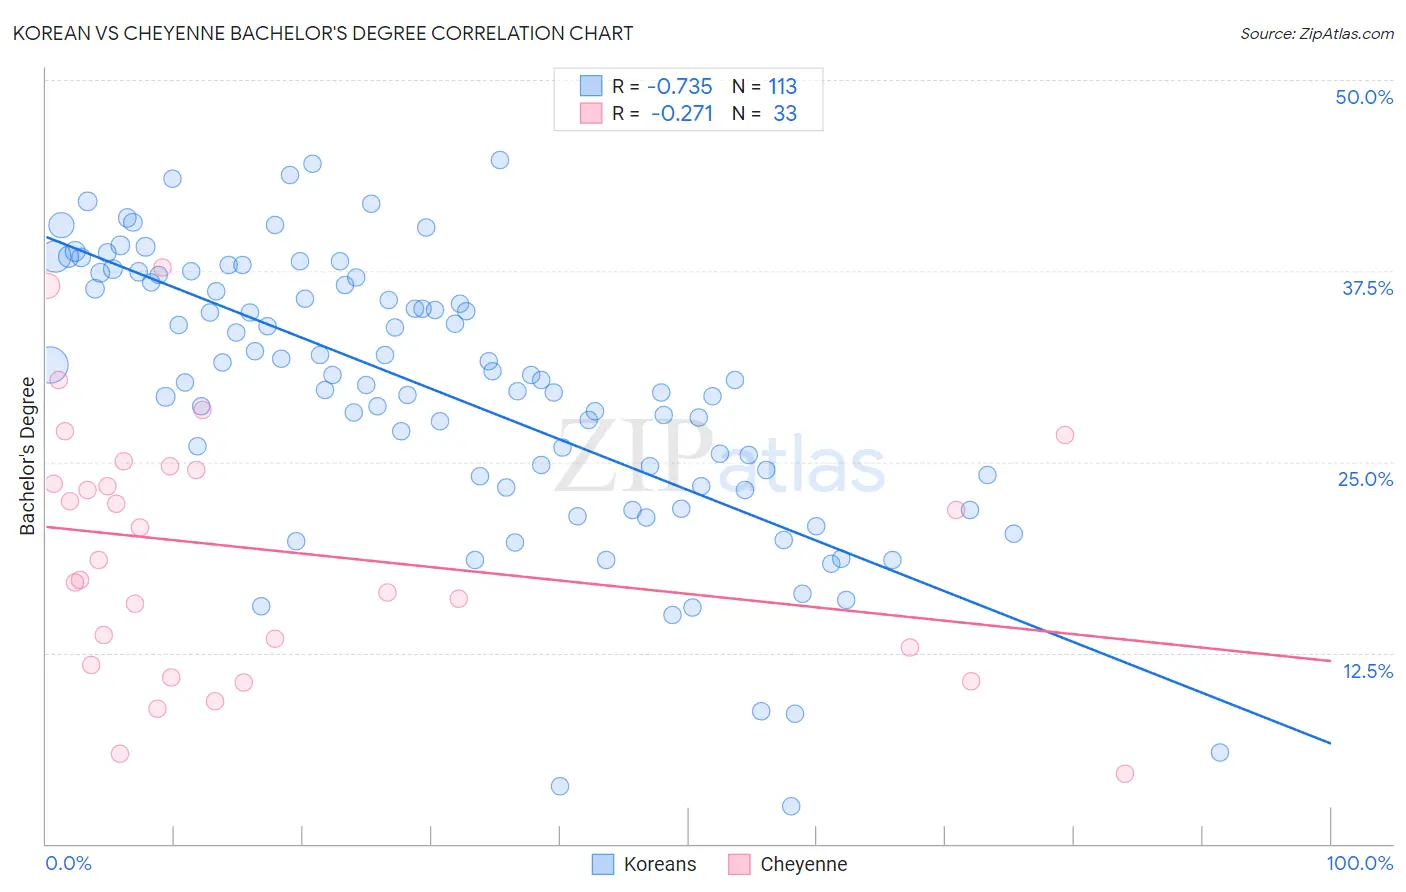
Korean vs Cheyenne Bachelor's Degree Correlation Chart
The statistical analysis conducted on geographies consisting of 510,872,242 people shows a strong negative correlation between the proportion of Koreans and percentage of population with at least bachelor's degree education in the United States with a correlation coefficient (R) of -0.735 and weighted average of 37.0%. Similarly, the statistical analysis conducted on geographies consisting of 80,718,972 people shows a weak negative correlation between the proportion of Cheyenne and percentage of population with at least bachelor's degree education in the United States with a correlation coefficient (R) of -0.271 and weighted average of 29.4%, a difference of 25.8%.
Bachelor's Degree Correlation Summary
| Measurement | Korean | Cheyenne |
| Minimum | 2.5% | 4.6% |
| Maximum | 44.8% | 37.7% |
| Range | 42.3% | 33.1% |
| Mean | 29.6% | 19.1% |
| Median | 30.4% | 18.6% |
| Interquartile 25% (IQ1) | 23.7% | 12.3% |
| Interquartile 75% (IQ3) | 36.9% | 24.6% |
| Interquartile Range (IQR) | 13.2% | 12.3% |
| Standard Deviation (Sample) | 9.0% | 8.2% |
| Standard Deviation (Population) | 9.0% | 8.1% |
Similar Demographics by Bachelor's Degree
Demographics Similar to Koreans by Bachelor's Degree
In terms of bachelor's degree, the demographic groups most similar to Koreans are Belgian (37.0%, a difference of 0.010%), Celtic (37.0%, a difference of 0.030%), Czechoslovakian (37.0%, a difference of 0.070%), Welsh (37.0%, a difference of 0.080%), and Yugoslavian (37.1%, a difference of 0.20%).
| Demographics | Rating | Rank | Bachelor's Degree |
| Immigrants | Oceania | 37.3 /100 | #188 | Fair 37.3% |
| Slovaks | 36.9 /100 | #189 | Fair 37.3% |
| Swiss | 34.1 /100 | #190 | Fair 37.2% |
| Nigerians | 33.9 /100 | #191 | Fair 37.2% |
| Immigrants | Vietnam | 32.1 /100 | #192 | Fair 37.1% |
| Yugoslavians | 31.5 /100 | #193 | Fair 37.1% |
| Belgians | 29.9 /100 | #194 | Fair 37.0% |
| Koreans | 29.8 /100 | #195 | Fair 37.0% |
| Celtics | 29.5 /100 | #196 | Fair 37.0% |
| Czechoslovakians | 29.2 /100 | #197 | Fair 37.0% |
| Welsh | 29.1 /100 | #198 | Fair 37.0% |
| Immigrants | Costa Rica | 27.4 /100 | #199 | Fair 36.9% |
| Immigrants | Ghana | 27.4 /100 | #200 | Fair 36.9% |
| Immigrants | South Eastern Asia | 25.4 /100 | #201 | Fair 36.8% |
| Immigrants | Zaire | 25.3 /100 | #202 | Fair 36.8% |
Demographics Similar to Cheyenne by Bachelor's Degree
In terms of bachelor's degree, the demographic groups most similar to Cheyenne are Choctaw (29.4%, a difference of 0.070%), Seminole (29.4%, a difference of 0.13%), Alaska Native (29.4%, a difference of 0.31%), Hispanic or Latino (29.6%, a difference of 0.47%), and Shoshone (29.3%, a difference of 0.60%).
| Demographics | Rating | Rank | Bachelor's Degree |
| Bangladeshis | 0.0 /100 | #303 | Tragic 30.2% |
| Cherokee | 0.0 /100 | #304 | Tragic 30.2% |
| Immigrants | Latin America | 0.0 /100 | #305 | Tragic 30.1% |
| Immigrants | Yemen | 0.0 /100 | #306 | Tragic 29.9% |
| Nepalese | 0.0 /100 | #307 | Tragic 29.9% |
| Cajuns | 0.0 /100 | #308 | Tragic 29.6% |
| Hispanics or Latinos | 0.0 /100 | #309 | Tragic 29.6% |
| Cheyenne | 0.0 /100 | #310 | Tragic 29.4% |
| Choctaw | 0.0 /100 | #311 | Tragic 29.4% |
| Seminole | 0.0 /100 | #312 | Tragic 29.4% |
| Alaska Natives | 0.0 /100 | #313 | Tragic 29.4% |
| Shoshone | 0.0 /100 | #314 | Tragic 29.3% |
| Immigrants | Cabo Verde | 0.0 /100 | #315 | Tragic 29.2% |
| Sioux | 0.0 /100 | #316 | Tragic 29.1% |
| Colville | 0.0 /100 | #317 | Tragic 29.0% |