Korean vs Immigrants from West Indies Bachelor's Degree
COMPARE
Korean
Immigrants from West Indies
Bachelor's Degree
Bachelor's Degree Comparison
Koreans
Immigrants from West Indies
37.0%
BACHELOR'S DEGREE
29.8/ 100
METRIC RATING
195th/ 347
METRIC RANK
34.6%
BACHELOR'S DEGREE
2.9/ 100
METRIC RATING
235th/ 347
METRIC RANK
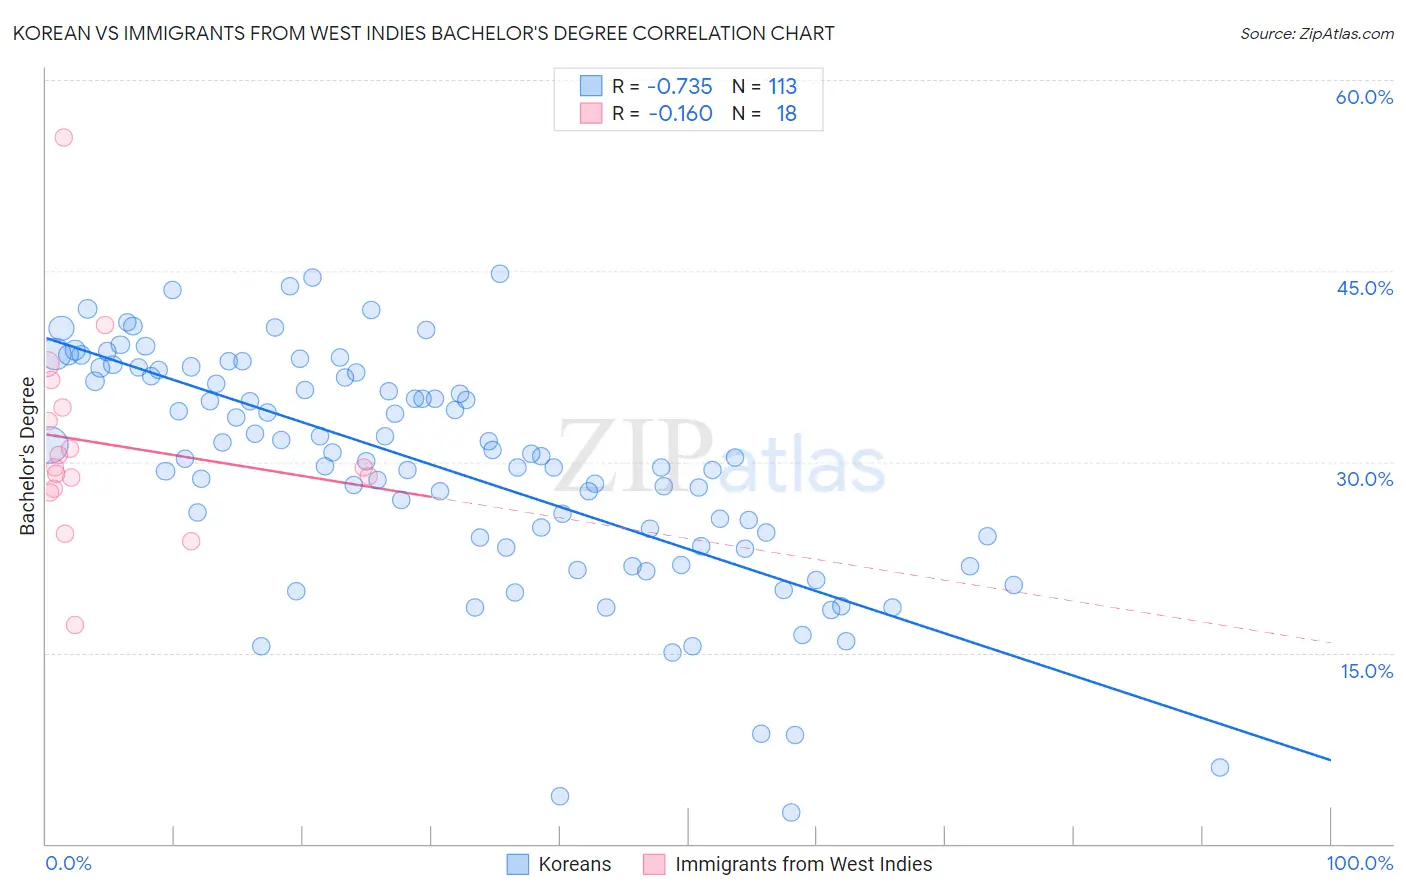
Korean vs Immigrants from West Indies Bachelor's Degree Correlation Chart
The statistical analysis conducted on geographies consisting of 510,872,242 people shows a strong negative correlation between the proportion of Koreans and percentage of population with at least bachelor's degree education in the United States with a correlation coefficient (R) of -0.735 and weighted average of 37.0%. Similarly, the statistical analysis conducted on geographies consisting of 72,420,477 people shows a poor negative correlation between the proportion of Immigrants from West Indies and percentage of population with at least bachelor's degree education in the United States with a correlation coefficient (R) of -0.160 and weighted average of 34.6%, a difference of 7.0%.
Bachelor's Degree Correlation Summary
| Measurement | Korean | Immigrants from West Indies |
| Minimum | 2.5% | 17.2% |
| Maximum | 44.8% | 55.5% |
| Range | 42.3% | 38.3% |
| Mean | 29.6% | 31.4% |
| Median | 30.4% | 29.5% |
| Interquartile 25% (IQ1) | 23.7% | 27.8% |
| Interquartile 75% (IQ3) | 36.9% | 34.3% |
| Interquartile Range (IQR) | 13.2% | 6.4% |
| Standard Deviation (Sample) | 9.0% | 8.1% |
| Standard Deviation (Population) | 9.0% | 7.8% |
Similar Demographics by Bachelor's Degree
Demographics Similar to Koreans by Bachelor's Degree
In terms of bachelor's degree, the demographic groups most similar to Koreans are Belgian (37.0%, a difference of 0.010%), Celtic (37.0%, a difference of 0.030%), Czechoslovakian (37.0%, a difference of 0.070%), Welsh (37.0%, a difference of 0.080%), and Yugoslavian (37.1%, a difference of 0.20%).
| Demographics | Rating | Rank | Bachelor's Degree |
| Immigrants | Oceania | 37.3 /100 | #188 | Fair 37.3% |
| Slovaks | 36.9 /100 | #189 | Fair 37.3% |
| Swiss | 34.1 /100 | #190 | Fair 37.2% |
| Nigerians | 33.9 /100 | #191 | Fair 37.2% |
| Immigrants | Vietnam | 32.1 /100 | #192 | Fair 37.1% |
| Yugoslavians | 31.5 /100 | #193 | Fair 37.1% |
| Belgians | 29.9 /100 | #194 | Fair 37.0% |
| Koreans | 29.8 /100 | #195 | Fair 37.0% |
| Celtics | 29.5 /100 | #196 | Fair 37.0% |
| Czechoslovakians | 29.2 /100 | #197 | Fair 37.0% |
| Welsh | 29.1 /100 | #198 | Fair 37.0% |
| Immigrants | Costa Rica | 27.4 /100 | #199 | Fair 36.9% |
| Immigrants | Ghana | 27.4 /100 | #200 | Fair 36.9% |
| Immigrants | South Eastern Asia | 25.4 /100 | #201 | Fair 36.8% |
| Immigrants | Zaire | 25.3 /100 | #202 | Fair 36.8% |
Demographics Similar to Immigrants from West Indies by Bachelor's Degree
In terms of bachelor's degree, the demographic groups most similar to Immigrants from West Indies are Guamanian/Chamorro (34.6%, a difference of 0.090%), Liberian (34.6%, a difference of 0.11%), Tlingit-Haida (34.6%, a difference of 0.14%), Immigrants from Ecuador (34.7%, a difference of 0.31%), and Hmong (34.8%, a difference of 0.42%).
| Demographics | Rating | Rank | Bachelor's Degree |
| Immigrants | Trinidad and Tobago | 6.0 /100 | #228 | Tragic 35.3% |
| Whites/Caucasians | 5.9 /100 | #229 | Tragic 35.3% |
| Immigrants | Grenada | 4.3 /100 | #230 | Tragic 35.0% |
| Immigrants | St. Vincent and the Grenadines | 4.3 /100 | #231 | Tragic 35.0% |
| Hmong | 3.4 /100 | #232 | Tragic 34.8% |
| Immigrants | Ecuador | 3.3 /100 | #233 | Tragic 34.7% |
| Guamanians/Chamorros | 3.0 /100 | #234 | Tragic 34.6% |
| Immigrants | West Indies | 2.9 /100 | #235 | Tragic 34.6% |
| Liberians | 2.8 /100 | #236 | Tragic 34.6% |
| Tlingit-Haida | 2.8 /100 | #237 | Tragic 34.6% |
| Guyanese | 2.5 /100 | #238 | Tragic 34.5% |
| British West Indians | 2.5 /100 | #239 | Tragic 34.5% |
| Tongans | 2.0 /100 | #240 | Tragic 34.3% |
| Immigrants | Cambodia | 1.9 /100 | #241 | Tragic 34.2% |
| Immigrants | Nonimmigrants | 1.8 /100 | #242 | Tragic 34.2% |