Laotian vs Immigrants from the Azores Bachelor's Degree
COMPARE
Laotian
Immigrants from the Azores
Bachelor's Degree
Bachelor's Degree Comparison
Laotians
Immigrants from the Azores
42.0%
BACHELOR'S DEGREE
98.9/ 100
METRIC RATING
90th/ 347
METRIC RANK
27.3%
BACHELOR'S DEGREE
0.0/ 100
METRIC RATING
331st/ 347
METRIC RANK
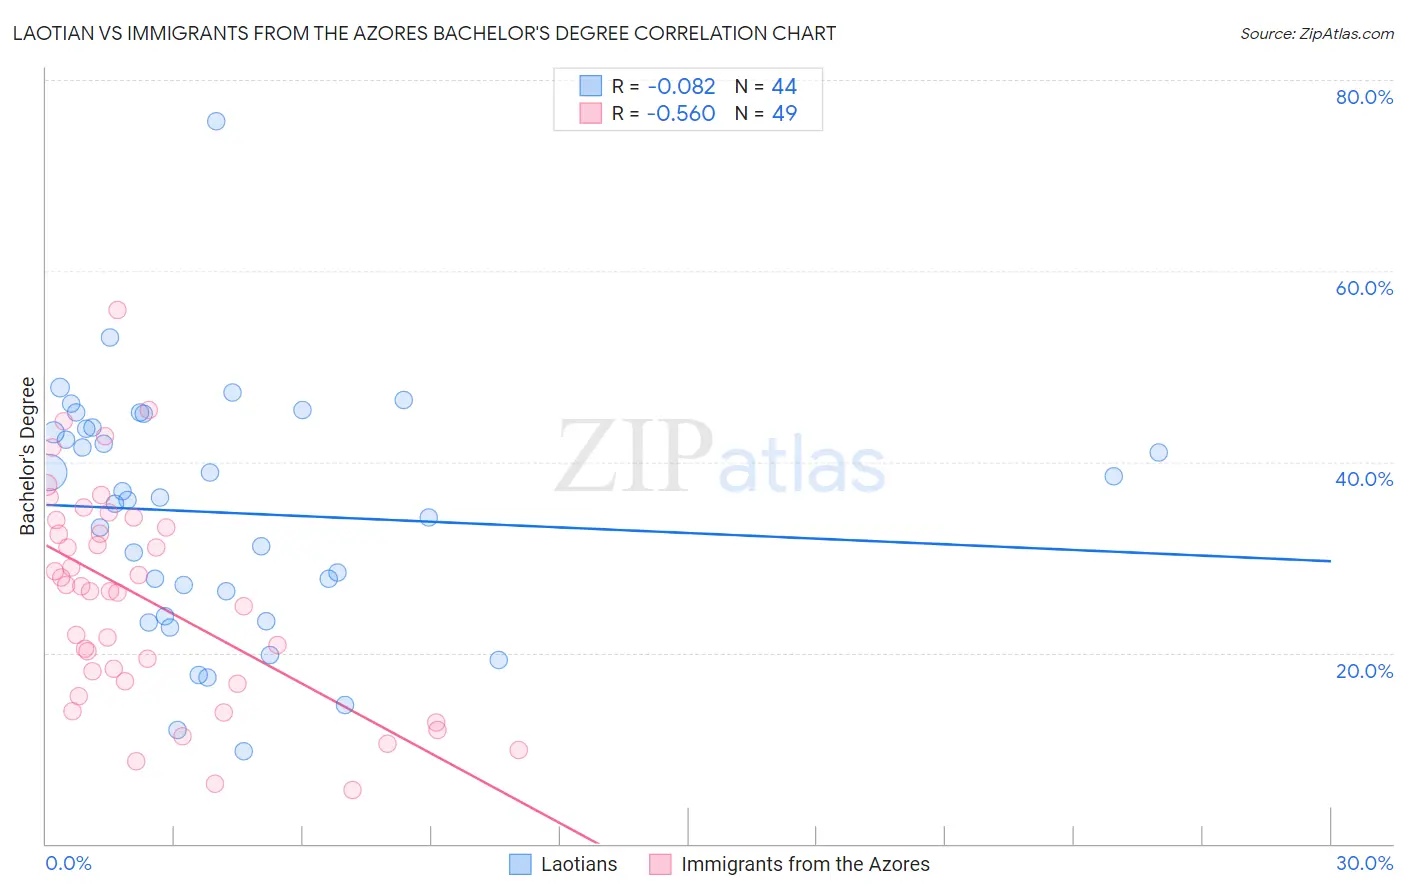
Laotian vs Immigrants from the Azores Bachelor's Degree Correlation Chart
The statistical analysis conducted on geographies consisting of 224,838,887 people shows a slight negative correlation between the proportion of Laotians and percentage of population with at least bachelor's degree education in the United States with a correlation coefficient (R) of -0.082 and weighted average of 42.0%. Similarly, the statistical analysis conducted on geographies consisting of 46,257,310 people shows a substantial negative correlation between the proportion of Immigrants from the Azores and percentage of population with at least bachelor's degree education in the United States with a correlation coefficient (R) of -0.560 and weighted average of 27.3%, a difference of 53.7%.
Bachelor's Degree Correlation Summary
| Measurement | Laotian | Immigrants from the Azores |
| Minimum | 9.7% | 5.6% |
| Maximum | 75.7% | 55.9% |
| Range | 66.0% | 50.3% |
| Mean | 34.6% | 25.6% |
| Median | 36.1% | 26.4% |
| Interquartile 25% (IQ1) | 25.1% | 16.9% |
| Interquartile 75% (IQ3) | 43.5% | 33.6% |
| Interquartile Range (IQR) | 18.4% | 16.6% |
| Standard Deviation (Sample) | 12.7% | 11.2% |
| Standard Deviation (Population) | 12.6% | 11.1% |
Similar Demographics by Bachelor's Degree
Demographics Similar to Laotians by Bachelor's Degree
In terms of bachelor's degree, the demographic groups most similar to Laotians are Immigrants from Northern Africa (41.9%, a difference of 0.10%), Greek (42.0%, a difference of 0.12%), Immigrants from Western Europe (42.0%, a difference of 0.13%), Maltese (41.9%, a difference of 0.17%), and Carpatho Rusyn (42.1%, a difference of 0.25%).
| Demographics | Rating | Rank | Bachelor's Degree |
| Armenians | 99.2 /100 | #83 | Exceptional 42.3% |
| Immigrants | Western Asia | 99.2 /100 | #84 | Exceptional 42.3% |
| Lithuanians | 99.2 /100 | #85 | Exceptional 42.2% |
| Immigrants | Brazil | 99.2 /100 | #86 | Exceptional 42.2% |
| Carpatho Rusyns | 99.0 /100 | #87 | Exceptional 42.1% |
| Immigrants | Western Europe | 99.0 /100 | #88 | Exceptional 42.0% |
| Greeks | 99.0 /100 | #89 | Exceptional 42.0% |
| Laotians | 98.9 /100 | #90 | Exceptional 42.0% |
| Immigrants | Northern Africa | 98.9 /100 | #91 | Exceptional 41.9% |
| Maltese | 98.8 /100 | #92 | Exceptional 41.9% |
| Immigrants | Canada | 98.6 /100 | #93 | Exceptional 41.7% |
| Immigrants | Nepal | 98.6 /100 | #94 | Exceptional 41.7% |
| Immigrants | North America | 98.5 /100 | #95 | Exceptional 41.7% |
| Immigrants | Moldova | 98.4 /100 | #96 | Exceptional 41.6% |
| Romanians | 98.4 /100 | #97 | Exceptional 41.6% |
Demographics Similar to Immigrants from the Azores by Bachelor's Degree
In terms of bachelor's degree, the demographic groups most similar to Immigrants from the Azores are Menominee (27.3%, a difference of 0.10%), Spanish American Indian (27.5%, a difference of 0.48%), Immigrants from Central America (27.5%, a difference of 0.54%), Mexican (27.1%, a difference of 0.92%), and Crow (27.7%, a difference of 1.5%).
| Demographics | Rating | Rank | Bachelor's Degree |
| Dutch West Indians | 0.0 /100 | #324 | Tragic 28.5% |
| Pennsylvania Germans | 0.0 /100 | #325 | Tragic 28.4% |
| Apache | 0.0 /100 | #326 | Tragic 28.3% |
| Paiute | 0.0 /100 | #327 | Tragic 28.1% |
| Crow | 0.0 /100 | #328 | Tragic 27.7% |
| Immigrants | Central America | 0.0 /100 | #329 | Tragic 27.5% |
| Spanish American Indians | 0.0 /100 | #330 | Tragic 27.5% |
| Immigrants | Azores | 0.0 /100 | #331 | Tragic 27.3% |
| Menominee | 0.0 /100 | #332 | Tragic 27.3% |
| Mexicans | 0.0 /100 | #333 | Tragic 27.1% |
| Arapaho | 0.0 /100 | #334 | Tragic 26.6% |
| Natives/Alaskans | 0.0 /100 | #335 | Tragic 26.3% |
| Immigrants | Mexico | 0.0 /100 | #336 | Tragic 26.1% |
| Inupiat | 0.0 /100 | #337 | Tragic 25.8% |
| Pueblo | 0.0 /100 | #338 | Tragic 25.5% |