Nicaraguan vs Immigrants from the Azores Bachelor's Degree
COMPARE
Nicaraguan
Immigrants from the Azores
Bachelor's Degree
Bachelor's Degree Comparison
Nicaraguans
Immigrants from the Azores
33.1%
BACHELOR'S DEGREE
0.6/ 100
METRIC RATING
256th/ 347
METRIC RANK
27.3%
BACHELOR'S DEGREE
0.0/ 100
METRIC RATING
331st/ 347
METRIC RANK
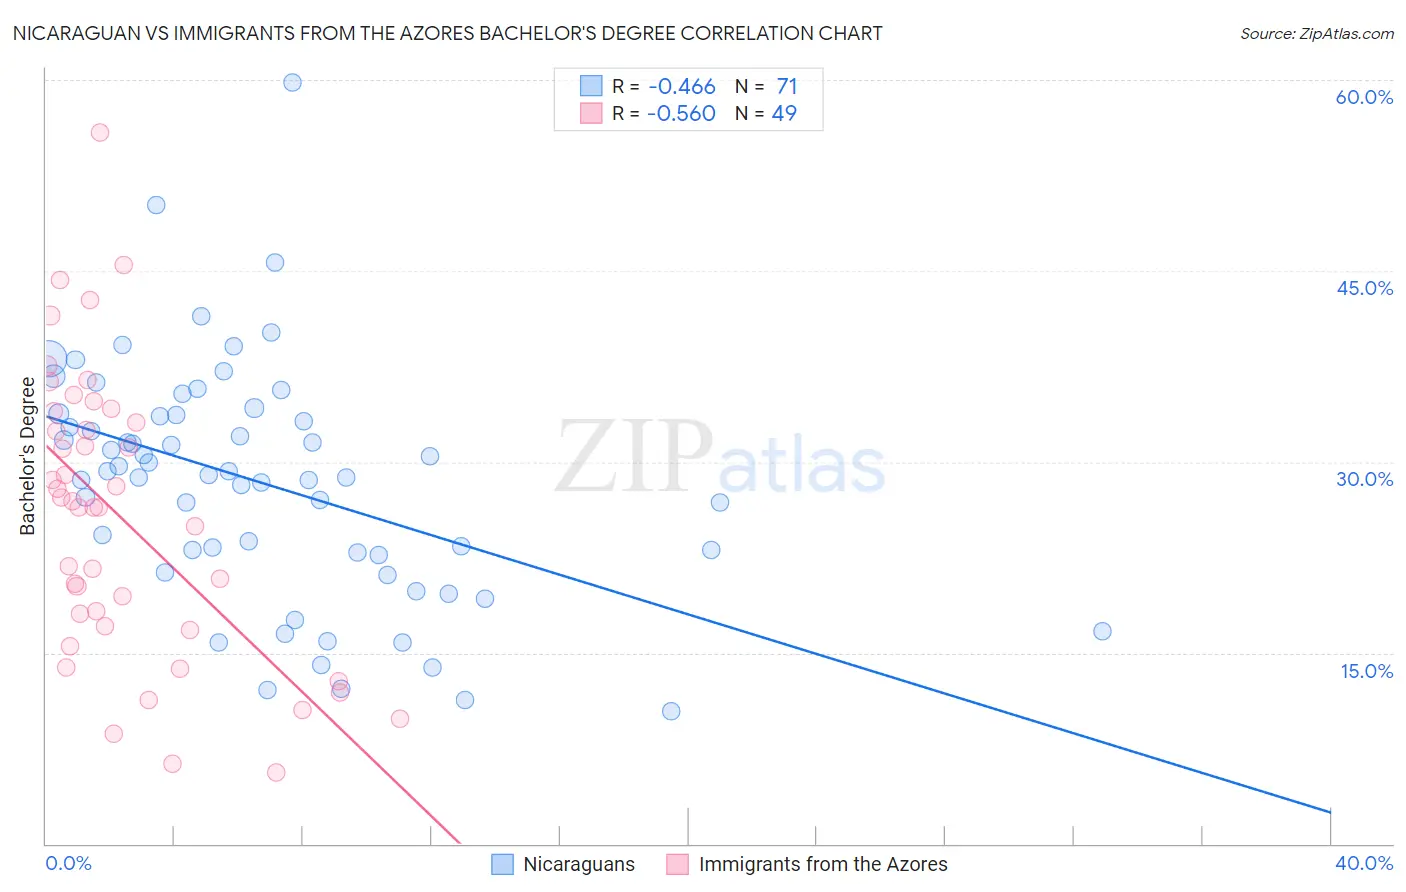
Nicaraguan vs Immigrants from the Azores Bachelor's Degree Correlation Chart
The statistical analysis conducted on geographies consisting of 285,704,287 people shows a moderate negative correlation between the proportion of Nicaraguans and percentage of population with at least bachelor's degree education in the United States with a correlation coefficient (R) of -0.466 and weighted average of 33.1%. Similarly, the statistical analysis conducted on geographies consisting of 46,257,310 people shows a substantial negative correlation between the proportion of Immigrants from the Azores and percentage of population with at least bachelor's degree education in the United States with a correlation coefficient (R) of -0.560 and weighted average of 27.3%, a difference of 21.3%.
Bachelor's Degree Correlation Summary
| Measurement | Nicaraguan | Immigrants from the Azores |
| Minimum | 10.4% | 5.6% |
| Maximum | 59.8% | 55.9% |
| Range | 49.4% | 50.3% |
| Mean | 28.3% | 25.6% |
| Median | 29.0% | 26.4% |
| Interquartile 25% (IQ1) | 22.7% | 16.9% |
| Interquartile 75% (IQ3) | 33.7% | 33.6% |
| Interquartile Range (IQR) | 11.0% | 16.6% |
| Standard Deviation (Sample) | 9.3% | 11.2% |
| Standard Deviation (Population) | 9.3% | 11.1% |
Similar Demographics by Bachelor's Degree
Demographics Similar to Nicaraguans by Bachelor's Degree
In terms of bachelor's degree, the demographic groups most similar to Nicaraguans are Iroquois (33.2%, a difference of 0.19%), Native Hawaiian (33.2%, a difference of 0.20%), Spanish American (33.1%, a difference of 0.22%), French American Indian (33.1%, a difference of 0.26%), and U.S. Virgin Islander (33.2%, a difference of 0.27%).
| Demographics | Rating | Rank | Bachelor's Degree |
| Immigrants | Liberia | 0.9 /100 | #249 | Tragic 33.5% |
| Indonesians | 0.9 /100 | #250 | Tragic 33.5% |
| Japanese | 0.7 /100 | #251 | Tragic 33.3% |
| Immigrants | Bahamas | 0.7 /100 | #252 | Tragic 33.3% |
| U.S. Virgin Islanders | 0.7 /100 | #253 | Tragic 33.2% |
| Native Hawaiians | 0.7 /100 | #254 | Tragic 33.2% |
| Iroquois | 0.7 /100 | #255 | Tragic 33.2% |
| Nicaraguans | 0.6 /100 | #256 | Tragic 33.1% |
| Spanish Americans | 0.6 /100 | #257 | Tragic 33.1% |
| French American Indians | 0.6 /100 | #258 | Tragic 33.1% |
| Osage | 0.5 /100 | #259 | Tragic 33.0% |
| Malaysians | 0.5 /100 | #260 | Tragic 32.9% |
| Africans | 0.5 /100 | #261 | Tragic 32.9% |
| Immigrants | Jamaica | 0.5 /100 | #262 | Tragic 32.9% |
| Belizeans | 0.4 /100 | #263 | Tragic 32.8% |
Demographics Similar to Immigrants from the Azores by Bachelor's Degree
In terms of bachelor's degree, the demographic groups most similar to Immigrants from the Azores are Menominee (27.3%, a difference of 0.10%), Spanish American Indian (27.5%, a difference of 0.48%), Immigrants from Central America (27.5%, a difference of 0.54%), Mexican (27.1%, a difference of 0.92%), and Crow (27.7%, a difference of 1.5%).
| Demographics | Rating | Rank | Bachelor's Degree |
| Dutch West Indians | 0.0 /100 | #324 | Tragic 28.5% |
| Pennsylvania Germans | 0.0 /100 | #325 | Tragic 28.4% |
| Apache | 0.0 /100 | #326 | Tragic 28.3% |
| Paiute | 0.0 /100 | #327 | Tragic 28.1% |
| Crow | 0.0 /100 | #328 | Tragic 27.7% |
| Immigrants | Central America | 0.0 /100 | #329 | Tragic 27.5% |
| Spanish American Indians | 0.0 /100 | #330 | Tragic 27.5% |
| Immigrants | Azores | 0.0 /100 | #331 | Tragic 27.3% |
| Menominee | 0.0 /100 | #332 | Tragic 27.3% |
| Mexicans | 0.0 /100 | #333 | Tragic 27.1% |
| Arapaho | 0.0 /100 | #334 | Tragic 26.6% |
| Natives/Alaskans | 0.0 /100 | #335 | Tragic 26.3% |
| Immigrants | Mexico | 0.0 /100 | #336 | Tragic 26.1% |
| Inupiat | 0.0 /100 | #337 | Tragic 25.8% |
| Pueblo | 0.0 /100 | #338 | Tragic 25.5% |