Korean vs Pima Bachelor's Degree
COMPARE
Korean
Pima
Bachelor's Degree
Bachelor's Degree Comparison
Koreans
Pima
37.0%
BACHELOR'S DEGREE
29.8/ 100
METRIC RATING
195th/ 347
METRIC RANK
23.2%
BACHELOR'S DEGREE
0.0/ 100
METRIC RATING
345th/ 347
METRIC RANK
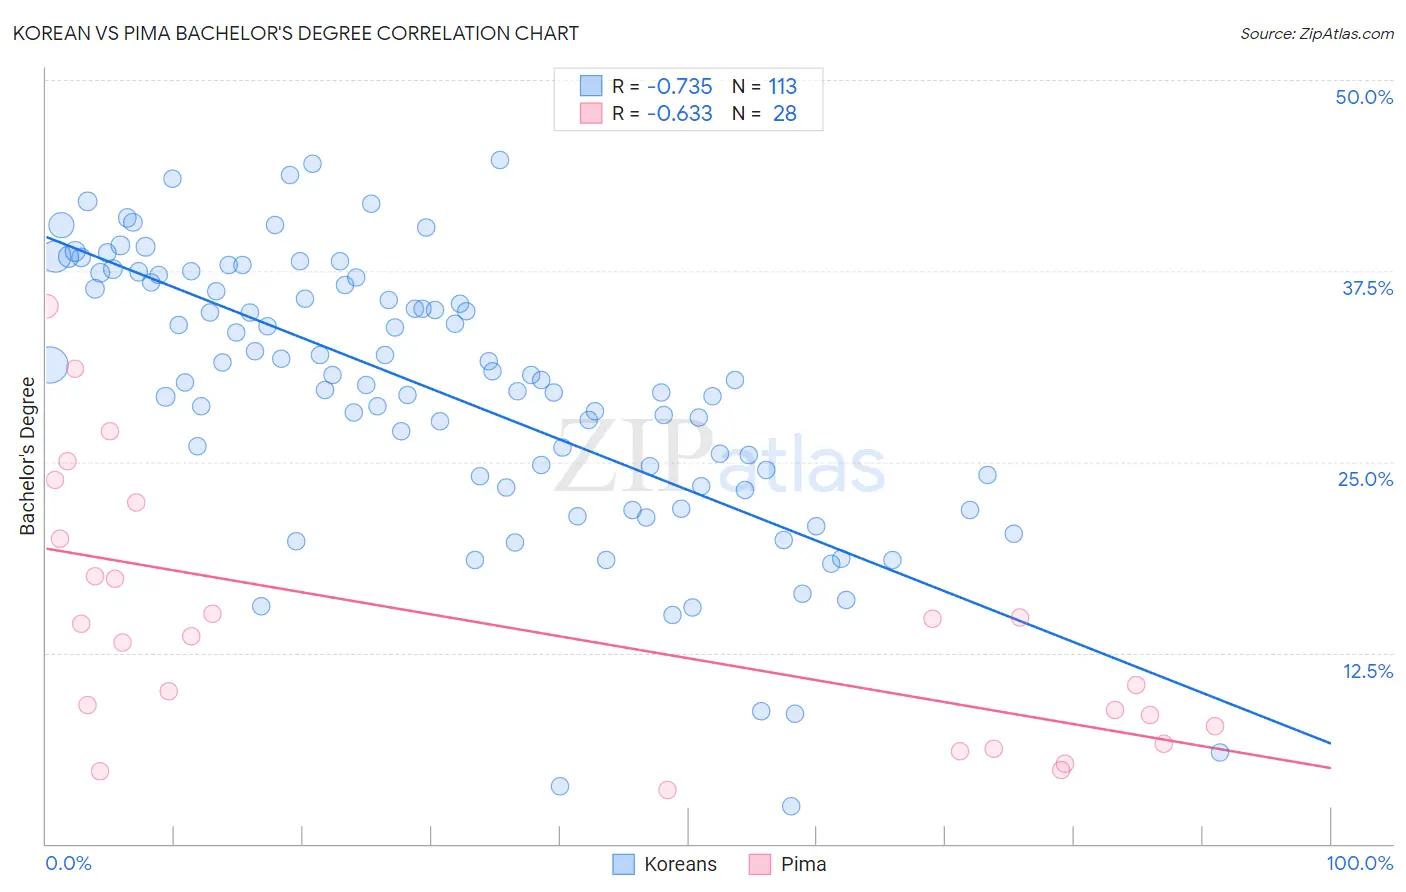
Korean vs Pima Bachelor's Degree Correlation Chart
The statistical analysis conducted on geographies consisting of 510,872,242 people shows a strong negative correlation between the proportion of Koreans and percentage of population with at least bachelor's degree education in the United States with a correlation coefficient (R) of -0.735 and weighted average of 37.0%. Similarly, the statistical analysis conducted on geographies consisting of 61,550,117 people shows a significant negative correlation between the proportion of Pima and percentage of population with at least bachelor's degree education in the United States with a correlation coefficient (R) of -0.633 and weighted average of 23.2%, a difference of 59.6%.
Bachelor's Degree Correlation Summary
| Measurement | Korean | Pima |
| Minimum | 2.5% | 3.5% |
| Maximum | 44.8% | 35.2% |
| Range | 42.3% | 31.6% |
| Mean | 29.6% | 14.2% |
| Median | 30.4% | 13.4% |
| Interquartile 25% (IQ1) | 23.7% | 7.1% |
| Interquartile 75% (IQ3) | 36.9% | 18.7% |
| Interquartile Range (IQR) | 13.2% | 11.6% |
| Standard Deviation (Sample) | 9.0% | 8.5% |
| Standard Deviation (Population) | 9.0% | 8.3% |
Similar Demographics by Bachelor's Degree
Demographics Similar to Koreans by Bachelor's Degree
In terms of bachelor's degree, the demographic groups most similar to Koreans are Belgian (37.0%, a difference of 0.010%), Celtic (37.0%, a difference of 0.030%), Czechoslovakian (37.0%, a difference of 0.070%), Welsh (37.0%, a difference of 0.080%), and Yugoslavian (37.1%, a difference of 0.20%).
| Demographics | Rating | Rank | Bachelor's Degree |
| Immigrants | Oceania | 37.3 /100 | #188 | Fair 37.3% |
| Slovaks | 36.9 /100 | #189 | Fair 37.3% |
| Swiss | 34.1 /100 | #190 | Fair 37.2% |
| Nigerians | 33.9 /100 | #191 | Fair 37.2% |
| Immigrants | Vietnam | 32.1 /100 | #192 | Fair 37.1% |
| Yugoslavians | 31.5 /100 | #193 | Fair 37.1% |
| Belgians | 29.9 /100 | #194 | Fair 37.0% |
| Koreans | 29.8 /100 | #195 | Fair 37.0% |
| Celtics | 29.5 /100 | #196 | Fair 37.0% |
| Czechoslovakians | 29.2 /100 | #197 | Fair 37.0% |
| Welsh | 29.1 /100 | #198 | Fair 37.0% |
| Immigrants | Costa Rica | 27.4 /100 | #199 | Fair 36.9% |
| Immigrants | Ghana | 27.4 /100 | #200 | Fair 36.9% |
| Immigrants | South Eastern Asia | 25.4 /100 | #201 | Fair 36.8% |
| Immigrants | Zaire | 25.3 /100 | #202 | Fair 36.8% |
Demographics Similar to Pima by Bachelor's Degree
In terms of bachelor's degree, the demographic groups most similar to Pima are Navajo (23.6%, a difference of 1.8%), Tohono O'odham (24.4%, a difference of 5.2%), Yakama (24.5%, a difference of 5.4%), Yuman (24.5%, a difference of 5.7%), and Lumbee (24.8%, a difference of 6.7%).
| Demographics | Rating | Rank | Bachelor's Degree |
| Mexicans | 0.0 /100 | #333 | Tragic 27.1% |
| Arapaho | 0.0 /100 | #334 | Tragic 26.6% |
| Natives/Alaskans | 0.0 /100 | #335 | Tragic 26.3% |
| Immigrants | Mexico | 0.0 /100 | #336 | Tragic 26.1% |
| Inupiat | 0.0 /100 | #337 | Tragic 25.8% |
| Pueblo | 0.0 /100 | #338 | Tragic 25.5% |
| Hopi | 0.0 /100 | #339 | Tragic 25.3% |
| Lumbee | 0.0 /100 | #340 | Tragic 24.8% |
| Yuman | 0.0 /100 | #341 | Tragic 24.5% |
| Yakama | 0.0 /100 | #342 | Tragic 24.5% |
| Tohono O'odham | 0.0 /100 | #343 | Tragic 24.4% |
| Navajo | 0.0 /100 | #344 | Tragic 23.6% |
| Pima | 0.0 /100 | #345 | Tragic 23.2% |
| Houma | 0.0 /100 | #346 | Tragic 21.4% |
| Yup'ik | 0.0 /100 | #347 | Tragic 19.4% |