Korean vs Immigrants from St. Vincent and the Grenadines College, 1 year or more
COMPARE
Korean
Immigrants from St. Vincent and the Grenadines
College, 1 year or more
College, 1 year or more Comparison
Koreans
Immigrants from St. Vincent and the Grenadines
59.7%
COLLEGE, 1 YEAR OR MORE
58.5/ 100
METRIC RATING
162nd/ 347
METRIC RANK
54.8%
COLLEGE, 1 YEAR OR MORE
0.3/ 100
METRIC RATING
262nd/ 347
METRIC RANK
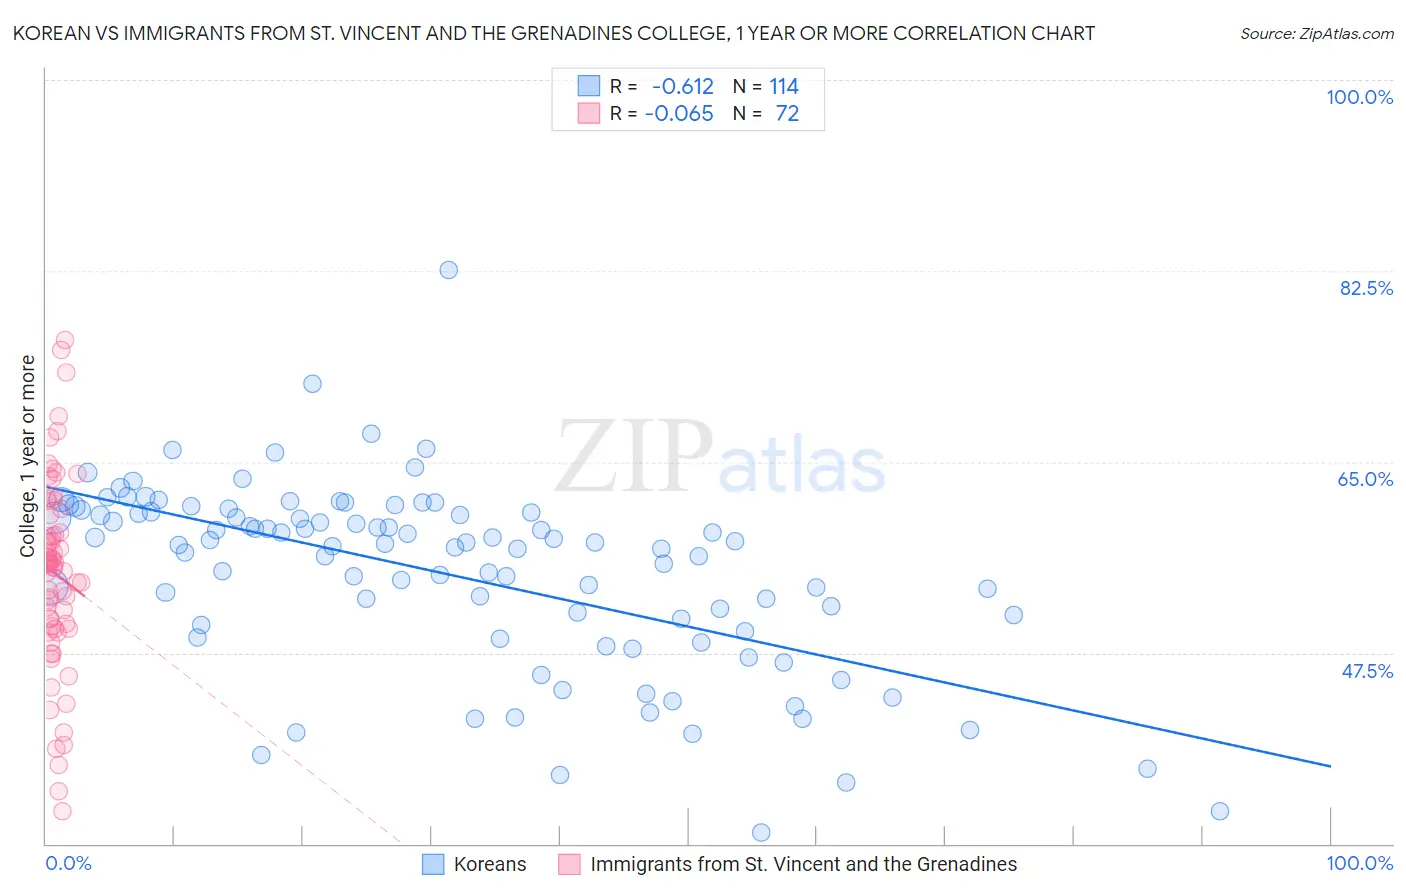
Korean vs Immigrants from St. Vincent and the Grenadines College, 1 year or more Correlation Chart
The statistical analysis conducted on geographies consisting of 510,942,861 people shows a significant negative correlation between the proportion of Koreans and percentage of population with at least college, 1 year or more education in the United States with a correlation coefficient (R) of -0.612 and weighted average of 59.7%. Similarly, the statistical analysis conducted on geographies consisting of 56,185,220 people shows a slight negative correlation between the proportion of Immigrants from St. Vincent and the Grenadines and percentage of population with at least college, 1 year or more education in the United States with a correlation coefficient (R) of -0.065 and weighted average of 54.8%, a difference of 8.9%.
College, 1 year or more Correlation Summary
| Measurement | Korean | Immigrants from St. Vincent and the Grenadines |
| Minimum | 31.0% | 33.0% |
| Maximum | 82.6% | 76.2% |
| Range | 51.6% | 43.2% |
| Mean | 54.8% | 54.8% |
| Median | 57.4% | 55.6% |
| Interquartile 25% (IQ1) | 50.1% | 49.8% |
| Interquartile 75% (IQ3) | 60.4% | 59.3% |
| Interquartile Range (IQR) | 10.3% | 9.5% |
| Standard Deviation (Sample) | 8.5% | 8.8% |
| Standard Deviation (Population) | 8.5% | 8.7% |
Similar Demographics by College, 1 year or more
Demographics Similar to Koreans by College, 1 year or more
In terms of college, 1 year or more, the demographic groups most similar to Koreans are Immigrants from Somalia (59.7%, a difference of 0.010%), Belgian (59.7%, a difference of 0.020%), Irish (59.6%, a difference of 0.13%), Immigrants from Africa (59.6%, a difference of 0.13%), and Immigrants from North Macedonia (59.5%, a difference of 0.29%).
| Demographics | Rating | Rank | College, 1 year or more |
| Moroccans | 72.9 /100 | #155 | Good 60.2% |
| Finns | 72.9 /100 | #156 | Good 60.2% |
| Immigrants | Armenia | 68.8 /100 | #157 | Good 60.0% |
| English | 67.2 /100 | #158 | Good 60.0% |
| Immigrants | Iraq | 67.0 /100 | #159 | Good 60.0% |
| South American Indians | 66.9 /100 | #160 | Good 60.0% |
| Somalis | 64.5 /100 | #161 | Good 59.9% |
| Koreans | 58.5 /100 | #162 | Average 59.7% |
| Immigrants | Somalia | 58.3 /100 | #163 | Average 59.7% |
| Belgians | 58.1 /100 | #164 | Average 59.7% |
| Irish | 56.1 /100 | #165 | Average 59.6% |
| Immigrants | Africa | 56.1 /100 | #166 | Average 59.6% |
| Immigrants | North Macedonia | 53.1 /100 | #167 | Average 59.5% |
| Hungarians | 52.9 /100 | #168 | Average 59.5% |
| Immigrants | Southern Europe | 52.7 /100 | #169 | Average 59.5% |
Demographics Similar to Immigrants from St. Vincent and the Grenadines by College, 1 year or more
In terms of college, 1 year or more, the demographic groups most similar to Immigrants from St. Vincent and the Grenadines are U.S. Virgin Islander (54.8%, a difference of 0.020%), Immigrants from Micronesia (54.8%, a difference of 0.050%), Ottawa (54.9%, a difference of 0.080%), Jamaican (54.9%, a difference of 0.11%), and Nepalese (54.9%, a difference of 0.21%).
| Demographics | Rating | Rank | College, 1 year or more |
| Immigrants | Bahamas | 0.5 /100 | #255 | Tragic 55.2% |
| Immigrants | West Indies | 0.5 /100 | #256 | Tragic 55.2% |
| Indonesians | 0.4 /100 | #257 | Tragic 55.1% |
| Africans | 0.4 /100 | #258 | Tragic 55.0% |
| Nepalese | 0.3 /100 | #259 | Tragic 54.9% |
| Jamaicans | 0.3 /100 | #260 | Tragic 54.9% |
| Ottawa | 0.3 /100 | #261 | Tragic 54.9% |
| Immigrants | St. Vincent and the Grenadines | 0.3 /100 | #262 | Tragic 54.8% |
| U.S. Virgin Islanders | 0.3 /100 | #263 | Tragic 54.8% |
| Immigrants | Micronesia | 0.3 /100 | #264 | Tragic 54.8% |
| Immigrants | Laos | 0.2 /100 | #265 | Tragic 54.7% |
| Potawatomi | 0.2 /100 | #266 | Tragic 54.6% |
| Blackfeet | 0.2 /100 | #267 | Tragic 54.6% |
| British West Indians | 0.2 /100 | #268 | Tragic 54.5% |
| Bangladeshis | 0.2 /100 | #269 | Tragic 54.5% |