Korean vs Hawaiian College, 1 year or more
COMPARE
Korean
Hawaiian
College, 1 year or more
College, 1 year or more Comparison
Koreans
Hawaiians
59.7%
COLLEGE, 1 YEAR OR MORE
58.5/ 100
METRIC RATING
162nd/ 347
METRIC RANK
55.6%
COLLEGE, 1 YEAR OR MORE
0.8/ 100
METRIC RATING
247th/ 347
METRIC RANK
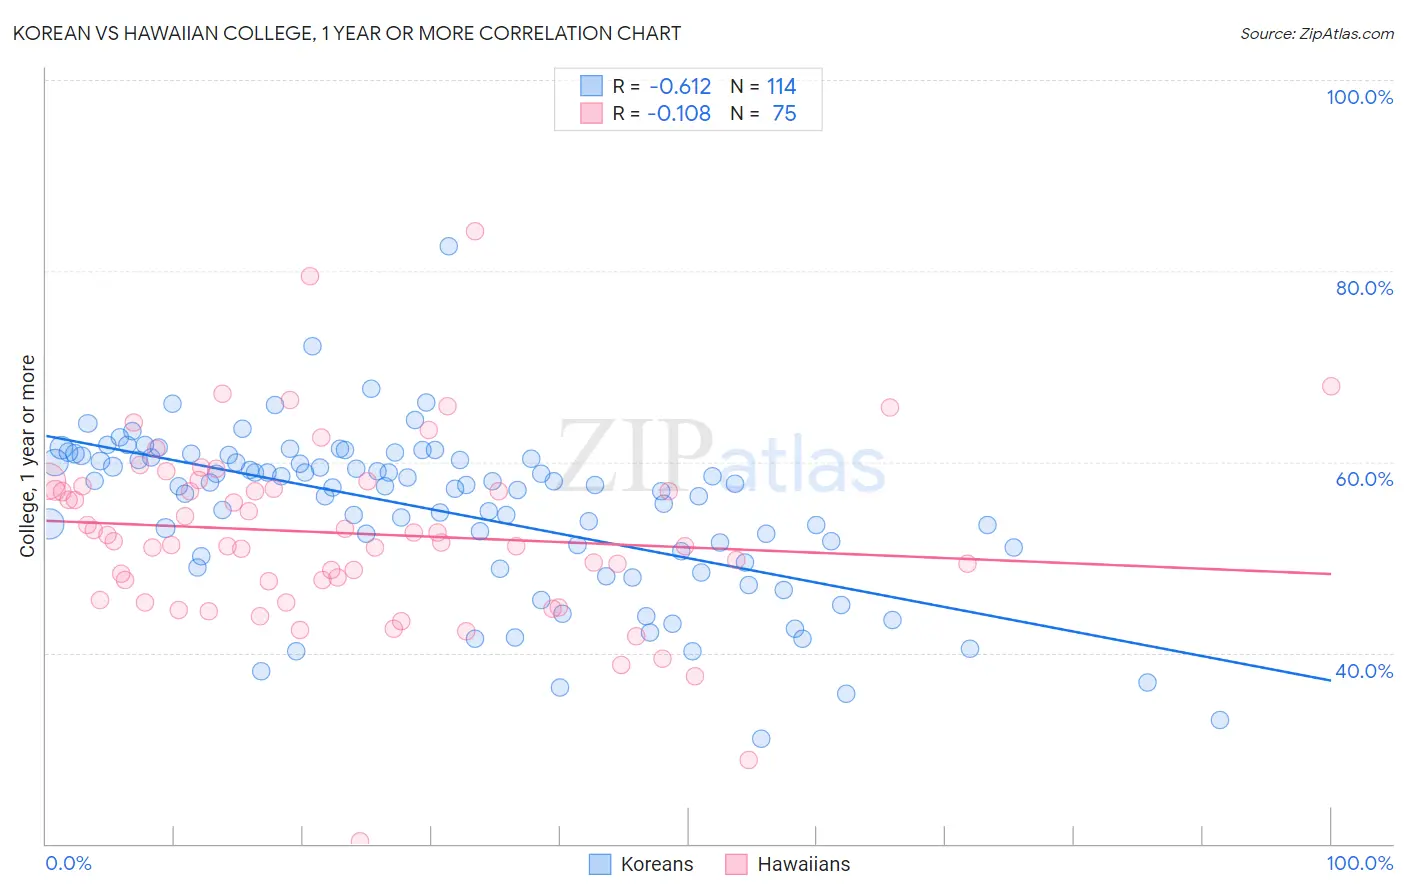
Korean vs Hawaiian College, 1 year or more Correlation Chart
The statistical analysis conducted on geographies consisting of 510,942,861 people shows a significant negative correlation between the proportion of Koreans and percentage of population with at least college, 1 year or more education in the United States with a correlation coefficient (R) of -0.612 and weighted average of 59.7%. Similarly, the statistical analysis conducted on geographies consisting of 327,619,549 people shows a poor negative correlation between the proportion of Hawaiians and percentage of population with at least college, 1 year or more education in the United States with a correlation coefficient (R) of -0.108 and weighted average of 55.6%, a difference of 7.4%.
College, 1 year or more Correlation Summary
| Measurement | Korean | Hawaiian |
| Minimum | 31.0% | 20.3% |
| Maximum | 82.6% | 84.1% |
| Range | 51.6% | 63.8% |
| Mean | 54.8% | 52.5% |
| Median | 57.4% | 51.7% |
| Interquartile 25% (IQ1) | 50.1% | 47.5% |
| Interquartile 75% (IQ3) | 60.4% | 57.4% |
| Interquartile Range (IQR) | 10.3% | 9.9% |
| Standard Deviation (Sample) | 8.5% | 9.7% |
| Standard Deviation (Population) | 8.5% | 9.7% |
Similar Demographics by College, 1 year or more
Demographics Similar to Koreans by College, 1 year or more
In terms of college, 1 year or more, the demographic groups most similar to Koreans are Immigrants from Somalia (59.7%, a difference of 0.010%), Belgian (59.7%, a difference of 0.020%), Irish (59.6%, a difference of 0.13%), Immigrants from Africa (59.6%, a difference of 0.13%), and Immigrants from North Macedonia (59.5%, a difference of 0.29%).
| Demographics | Rating | Rank | College, 1 year or more |
| Moroccans | 72.9 /100 | #155 | Good 60.2% |
| Finns | 72.9 /100 | #156 | Good 60.2% |
| Immigrants | Armenia | 68.8 /100 | #157 | Good 60.0% |
| English | 67.2 /100 | #158 | Good 60.0% |
| Immigrants | Iraq | 67.0 /100 | #159 | Good 60.0% |
| South American Indians | 66.9 /100 | #160 | Good 60.0% |
| Somalis | 64.5 /100 | #161 | Good 59.9% |
| Koreans | 58.5 /100 | #162 | Average 59.7% |
| Immigrants | Somalia | 58.3 /100 | #163 | Average 59.7% |
| Belgians | 58.1 /100 | #164 | Average 59.7% |
| Irish | 56.1 /100 | #165 | Average 59.6% |
| Immigrants | Africa | 56.1 /100 | #166 | Average 59.6% |
| Immigrants | North Macedonia | 53.1 /100 | #167 | Average 59.5% |
| Hungarians | 52.9 /100 | #168 | Average 59.5% |
| Immigrants | Southern Europe | 52.7 /100 | #169 | Average 59.5% |
Demographics Similar to Hawaiians by College, 1 year or more
In terms of college, 1 year or more, the demographic groups most similar to Hawaiians are Immigrants from Congo (55.6%, a difference of 0.040%), Malaysian (55.6%, a difference of 0.070%), Immigrants from Liberia (55.7%, a difference of 0.12%), Immigrants from Trinidad and Tobago (55.5%, a difference of 0.13%), and Delaware (55.5%, a difference of 0.16%).
| Demographics | Rating | Rank | College, 1 year or more |
| Trinidadians and Tobagonians | 1.1 /100 | #240 | Tragic 55.8% |
| French American Indians | 1.0 /100 | #241 | Tragic 55.8% |
| Marshallese | 1.0 /100 | #242 | Tragic 55.8% |
| Osage | 1.0 /100 | #243 | Tragic 55.8% |
| Chippewa | 0.9 /100 | #244 | Tragic 55.7% |
| Immigrants | Liberia | 0.8 /100 | #245 | Tragic 55.7% |
| Malaysians | 0.8 /100 | #246 | Tragic 55.6% |
| Hawaiians | 0.8 /100 | #247 | Tragic 55.6% |
| Immigrants | Congo | 0.8 /100 | #248 | Tragic 55.6% |
| Immigrants | Trinidad and Tobago | 0.7 /100 | #249 | Tragic 55.5% |
| Delaware | 0.7 /100 | #250 | Tragic 55.5% |
| Immigrants | Cambodia | 0.6 /100 | #251 | Tragic 55.4% |
| Aleuts | 0.6 /100 | #252 | Tragic 55.4% |
| Immigrants | Barbados | 0.6 /100 | #253 | Tragic 55.4% |
| Japanese | 0.5 /100 | #254 | Tragic 55.2% |