Dominican vs Immigrants from Bulgaria GED/Equivalency
COMPARE
Dominican
Immigrants from Bulgaria
GED/Equivalency
GED/Equivalency Comparison
Dominicans
Immigrants from Bulgaria
79.1%
GED/EQUIVALENCY
0.0/ 100
METRIC RATING
329th/ 347
METRIC RANK
87.8%
GED/EQUIVALENCY
99.1/ 100
METRIC RATING
66th/ 347
METRIC RANK
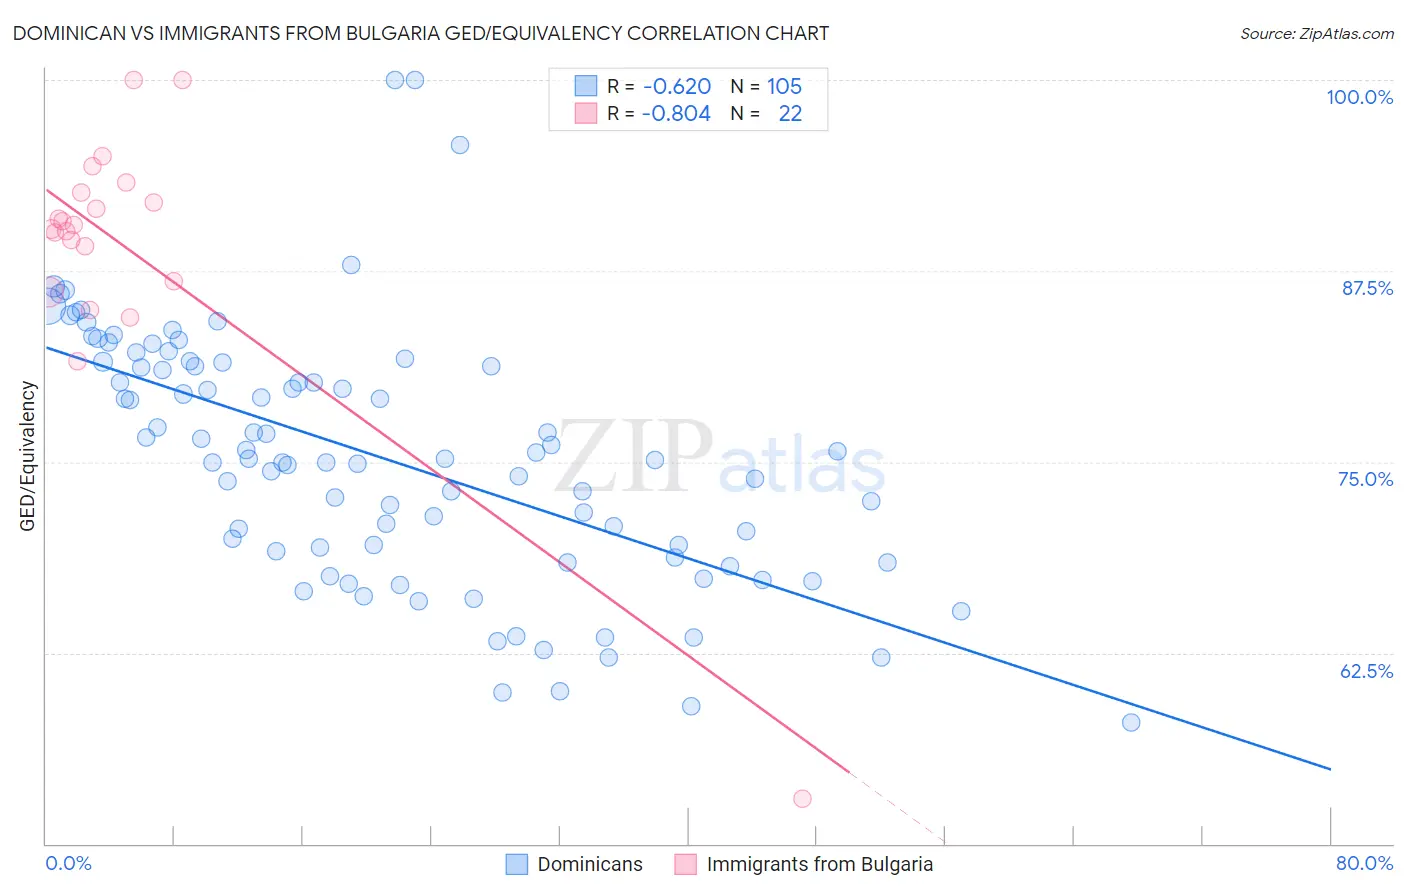
Dominican vs Immigrants from Bulgaria GED/Equivalency Correlation Chart
The statistical analysis conducted on geographies consisting of 355,143,187 people shows a significant negative correlation between the proportion of Dominicans and percentage of population with at least ged/equivalency education in the United States with a correlation coefficient (R) of -0.620 and weighted average of 79.1%. Similarly, the statistical analysis conducted on geographies consisting of 172,552,181 people shows a very strong negative correlation between the proportion of Immigrants from Bulgaria and percentage of population with at least ged/equivalency education in the United States with a correlation coefficient (R) of -0.804 and weighted average of 87.8%, a difference of 11.1%.
GED/Equivalency Correlation Summary
| Measurement | Dominican | Immigrants from Bulgaria |
| Minimum | 58.0% | 52.9% |
| Maximum | 100.0% | 100.0% |
| Range | 42.0% | 47.1% |
| Mean | 75.3% | 88.9% |
| Median | 75.2% | 90.4% |
| Interquartile 25% (IQ1) | 69.0% | 86.8% |
| Interquartile 75% (IQ3) | 81.4% | 92.6% |
| Interquartile Range (IQR) | 12.5% | 5.8% |
| Standard Deviation (Sample) | 8.3% | 9.2% |
| Standard Deviation (Population) | 8.3% | 9.0% |
Similar Demographics by GED/Equivalency
Demographics Similar to Dominicans by GED/Equivalency
In terms of ged/equivalency, the demographic groups most similar to Dominicans are Hispanic or Latino (79.1%, a difference of 0.050%), Central American (79.2%, a difference of 0.15%), Immigrants from Cabo Verde (78.9%, a difference of 0.16%), Yuman (79.2%, a difference of 0.17%), and Honduran (79.3%, a difference of 0.27%).
| Demographics | Rating | Rank | GED/Equivalency |
| Lumbee | 0.0 /100 | #322 | Tragic 80.0% |
| Immigrants | Nicaragua | 0.0 /100 | #323 | Tragic 79.9% |
| Mexican American Indians | 0.0 /100 | #324 | Tragic 79.4% |
| Hondurans | 0.0 /100 | #325 | Tragic 79.3% |
| Yuman | 0.0 /100 | #326 | Tragic 79.2% |
| Central Americans | 0.0 /100 | #327 | Tragic 79.2% |
| Hispanics or Latinos | 0.0 /100 | #328 | Tragic 79.1% |
| Dominicans | 0.0 /100 | #329 | Tragic 79.1% |
| Immigrants | Cabo Verde | 0.0 /100 | #330 | Tragic 78.9% |
| Immigrants | Honduras | 0.0 /100 | #331 | Tragic 78.7% |
| Immigrants | Azores | 0.0 /100 | #332 | Tragic 78.7% |
| Salvadorans | 0.0 /100 | #333 | Tragic 78.6% |
| Guatemalans | 0.0 /100 | #334 | Tragic 78.5% |
| Immigrants | Latin America | 0.0 /100 | #335 | Tragic 78.5% |
| Immigrants | Dominican Republic | 0.0 /100 | #336 | Tragic 78.0% |
Demographics Similar to Immigrants from Bulgaria by GED/Equivalency
In terms of ged/equivalency, the demographic groups most similar to Immigrants from Bulgaria are Immigrants from North America (87.8%, a difference of 0.0%), British (87.8%, a difference of 0.010%), Immigrants from France (87.8%, a difference of 0.010%), Immigrants from Canada (87.9%, a difference of 0.030%), and Immigrants from Turkey (87.9%, a difference of 0.070%).
| Demographics | Rating | Rank | GED/Equivalency |
| Serbians | 99.3 /100 | #59 | Exceptional 87.9% |
| Scandinavians | 99.3 /100 | #60 | Exceptional 87.9% |
| Europeans | 99.3 /100 | #61 | Exceptional 87.9% |
| Germans | 99.3 /100 | #62 | Exceptional 87.9% |
| Immigrants | Turkey | 99.2 /100 | #63 | Exceptional 87.9% |
| Immigrants | Canada | 99.2 /100 | #64 | Exceptional 87.9% |
| Immigrants | North America | 99.1 /100 | #65 | Exceptional 87.8% |
| Immigrants | Bulgaria | 99.1 /100 | #66 | Exceptional 87.8% |
| British | 99.1 /100 | #67 | Exceptional 87.8% |
| Immigrants | France | 99.1 /100 | #68 | Exceptional 87.8% |
| Immigrants | Saudi Arabia | 99.0 /100 | #69 | Exceptional 87.8% |
| Ukrainians | 98.8 /100 | #70 | Exceptional 87.7% |
| Austrians | 98.8 /100 | #71 | Exceptional 87.7% |
| Immigrants | Moldova | 98.8 /100 | #72 | Exceptional 87.7% |
| Belgians | 98.8 /100 | #73 | Exceptional 87.7% |