Japanese vs Ukrainian Median Family Income
COMPARE
Japanese
Ukrainian
Median Family Income
Median Family Income Comparison
Japanese
Ukrainians
$97,288
MEDIAN FAMILY INCOME
6.0/ 100
METRIC RATING
217th/ 347
METRIC RANK
$111,368
MEDIAN FAMILY INCOME
98.8/ 100
METRIC RATING
86th/ 347
METRIC RANK
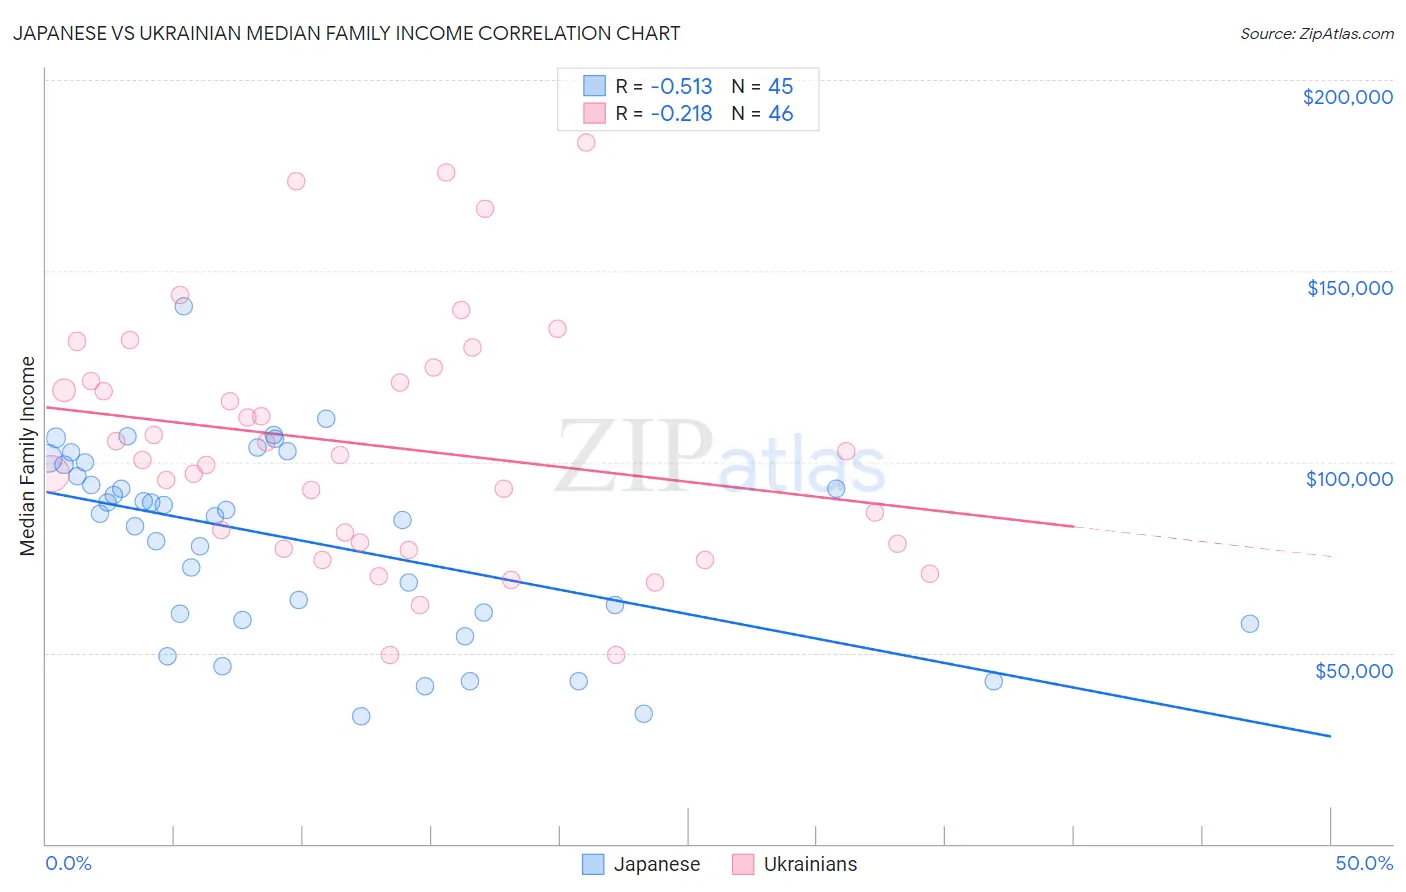
Japanese vs Ukrainian Median Family Income Correlation Chart
The statistical analysis conducted on geographies consisting of 249,024,827 people shows a substantial negative correlation between the proportion of Japanese and median family income in the United States with a correlation coefficient (R) of -0.513 and weighted average of $97,288. Similarly, the statistical analysis conducted on geographies consisting of 448,126,657 people shows a weak negative correlation between the proportion of Ukrainians and median family income in the United States with a correlation coefficient (R) of -0.218 and weighted average of $111,368, a difference of 14.5%.
Median Family Income Correlation Summary
| Measurement | Japanese | Ukrainian |
| Minimum | $33,448 | $49,418 |
| Maximum | $140,649 | $183,477 |
| Range | $107,201 | $134,059 |
| Mean | $79,706 | $104,354 |
| Median | $86,545 | $101,148 |
| Interquartile 25% (IQ1) | $59,337 | $78,581 |
| Interquartile 75% (IQ3) | $99,518 | $121,262 |
| Interquartile Range (IQR) | $40,181 | $42,681 |
| Standard Deviation (Sample) | $24,734 | $32,156 |
| Standard Deviation (Population) | $24,457 | $31,804 |
Similar Demographics by Median Family Income
Demographics Similar to Japanese by Median Family Income
In terms of median family income, the demographic groups most similar to Japanese are Immigrants from Cambodia ($97,222, a difference of 0.070%), Immigrants from Bosnia and Herzegovina ($97,432, a difference of 0.15%), Nigerian ($97,522, a difference of 0.24%), Bermudan ($97,577, a difference of 0.30%), and Immigrants from Armenia ($97,605, a difference of 0.33%).
| Demographics | Rating | Rank | Median Family Income |
| Puget Sound Salish | 8.2 /100 | #210 | Tragic $97,958 |
| Immigrants | Sudan | 7.4 /100 | #211 | Tragic $97,737 |
| Panamanians | 7.2 /100 | #212 | Tragic $97,683 |
| Immigrants | Armenia | 7.0 /100 | #213 | Tragic $97,605 |
| Bermudans | 6.9 /100 | #214 | Tragic $97,577 |
| Nigerians | 6.7 /100 | #215 | Tragic $97,522 |
| Immigrants | Bosnia and Herzegovina | 6.4 /100 | #216 | Tragic $97,432 |
| Japanese | 6.0 /100 | #217 | Tragic $97,288 |
| Immigrants | Cambodia | 5.8 /100 | #218 | Tragic $97,222 |
| Delaware | 5.1 /100 | #219 | Tragic $96,958 |
| Sudanese | 4.7 /100 | #220 | Tragic $96,783 |
| Immigrants | Ghana | 4.2 /100 | #221 | Tragic $96,544 |
| Immigrants | Nigeria | 4.0 /100 | #222 | Tragic $96,439 |
| Venezuelans | 3.7 /100 | #223 | Tragic $96,281 |
| Immigrants | Nonimmigrants | 3.6 /100 | #224 | Tragic $96,231 |
Demographics Similar to Ukrainians by Median Family Income
In terms of median family income, the demographic groups most similar to Ukrainians are Croatian ($111,370, a difference of 0.0%), Immigrants from Hungary ($111,378, a difference of 0.010%), Austrian ($111,306, a difference of 0.060%), Romanian ($111,243, a difference of 0.11%), and Immigrants from Egypt ($111,689, a difference of 0.29%).
| Demographics | Rating | Rank | Median Family Income |
| Italians | 99.3 /100 | #79 | Exceptional $112,372 |
| Immigrants | Croatia | 99.3 /100 | #80 | Exceptional $112,323 |
| Immigrants | North America | 99.2 /100 | #81 | Exceptional $112,151 |
| Immigrants | England | 99.2 /100 | #82 | Exceptional $112,038 |
| Immigrants | Egypt | 99.0 /100 | #83 | Exceptional $111,689 |
| Immigrants | Hungary | 98.8 /100 | #84 | Exceptional $111,378 |
| Croatians | 98.8 /100 | #85 | Exceptional $111,370 |
| Ukrainians | 98.8 /100 | #86 | Exceptional $111,368 |
| Austrians | 98.8 /100 | #87 | Exceptional $111,306 |
| Romanians | 98.8 /100 | #88 | Exceptional $111,243 |
| Immigrants | Argentina | 98.5 /100 | #89 | Exceptional $110,873 |
| Northern Europeans | 98.3 /100 | #90 | Exceptional $110,635 |
| Immigrants | Southern Europe | 98.3 /100 | #91 | Exceptional $110,614 |
| Immigrants | Lebanon | 97.9 /100 | #92 | Exceptional $110,159 |
| Immigrants | Kazakhstan | 97.8 /100 | #93 | Exceptional $110,137 |