Pennsylvania German vs Tohono O'odham Associate's Degree
COMPARE
Pennsylvania German
Tohono O'odham
Associate's Degree
Associate's Degree Comparison
Pennsylvania Germans
Tohono O'odham
37.2%
ASSOCIATE'S DEGREE
0.0/ 100
METRIC RATING
322nd/ 347
METRIC RANK
31.8%
ASSOCIATE'S DEGREE
0.0/ 100
METRIC RATING
343rd/ 347
METRIC RANK
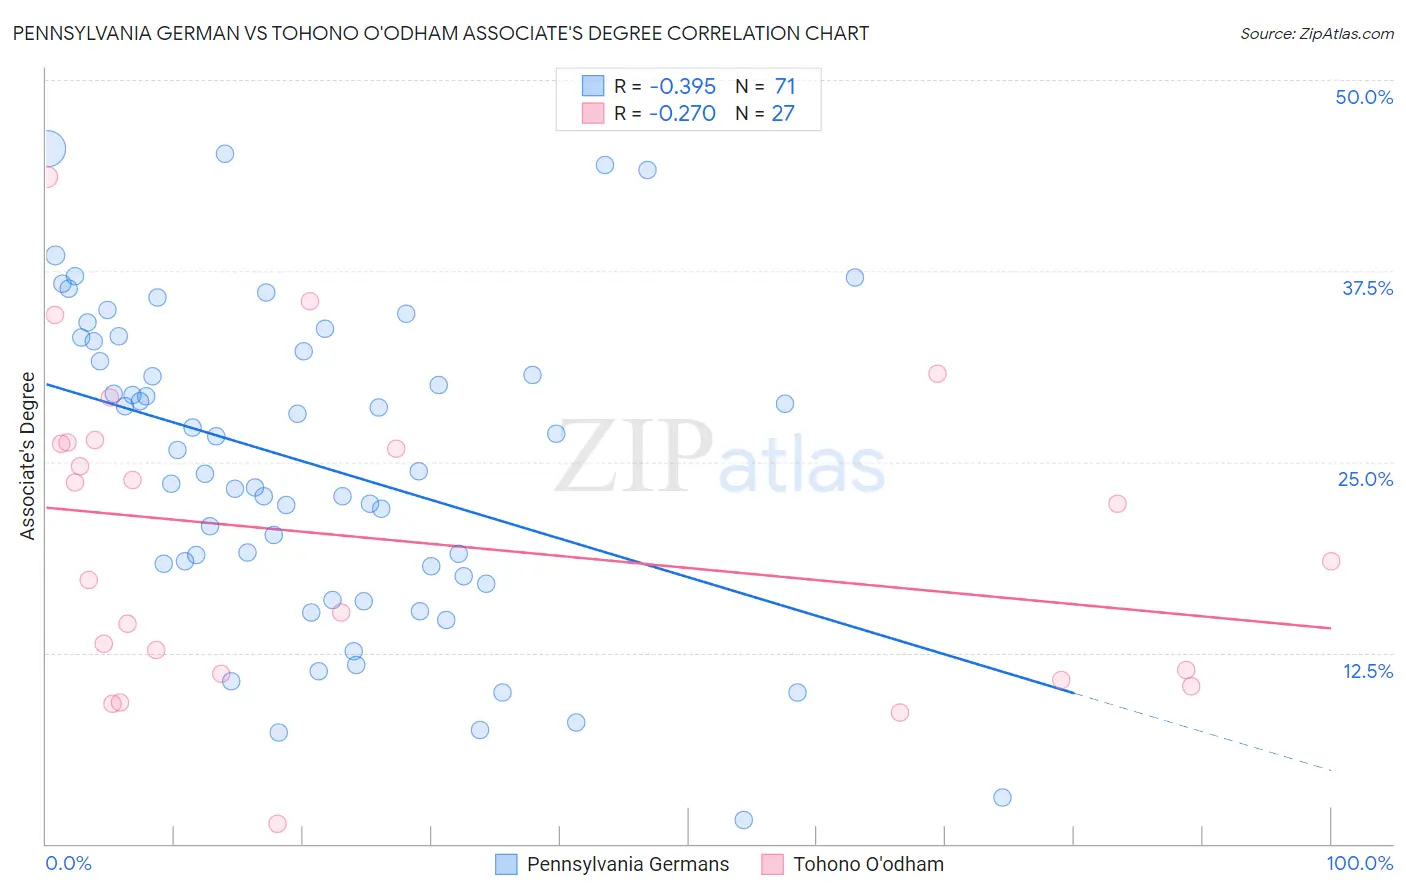
Pennsylvania German vs Tohono O'odham Associate's Degree Correlation Chart
The statistical analysis conducted on geographies consisting of 234,093,670 people shows a mild negative correlation between the proportion of Pennsylvania Germans and percentage of population with at least associate's degree education in the United States with a correlation coefficient (R) of -0.395 and weighted average of 37.2%. Similarly, the statistical analysis conducted on geographies consisting of 58,725,971 people shows a weak negative correlation between the proportion of Tohono O'odham and percentage of population with at least associate's degree education in the United States with a correlation coefficient (R) of -0.270 and weighted average of 31.8%, a difference of 17.1%.
Associate's Degree Correlation Summary
| Measurement | Pennsylvania German | Tohono O'odham |
| Minimum | 1.6% | 1.3% |
| Maximum | 45.5% | 43.7% |
| Range | 44.0% | 42.4% |
| Mean | 24.7% | 19.8% |
| Median | 24.4% | 18.5% |
| Interquartile 25% (IQ1) | 17.5% | 11.2% |
| Interquartile 75% (IQ3) | 32.9% | 26.2% |
| Interquartile Range (IQR) | 15.3% | 15.1% |
| Standard Deviation (Sample) | 10.3% | 10.1% |
| Standard Deviation (Population) | 10.2% | 9.9% |
Similar Demographics by Associate's Degree
Demographics Similar to Pennsylvania Germans by Associate's Degree
In terms of associate's degree, the demographic groups most similar to Pennsylvania Germans are Immigrants from Yemen (37.3%, a difference of 0.29%), Cajun (37.4%, a difference of 0.40%), Fijian (37.4%, a difference of 0.43%), Alaska Native (37.5%, a difference of 0.66%), and Yaqui (37.6%, a difference of 0.89%).
| Demographics | Rating | Rank | Associate's Degree |
| Creek | 0.0 /100 | #315 | Tragic 37.6% |
| Crow | 0.0 /100 | #316 | Tragic 37.6% |
| Yaqui | 0.0 /100 | #317 | Tragic 37.6% |
| Alaska Natives | 0.0 /100 | #318 | Tragic 37.5% |
| Fijians | 0.0 /100 | #319 | Tragic 37.4% |
| Cajuns | 0.0 /100 | #320 | Tragic 37.4% |
| Immigrants | Yemen | 0.0 /100 | #321 | Tragic 37.3% |
| Pennsylvania Germans | 0.0 /100 | #322 | Tragic 37.2% |
| Immigrants | Cabo Verde | 0.0 /100 | #323 | Tragic 36.8% |
| Arapaho | 0.0 /100 | #324 | Tragic 36.7% |
| Menominee | 0.0 /100 | #325 | Tragic 36.7% |
| Kiowa | 0.0 /100 | #326 | Tragic 36.5% |
| Dutch West Indians | 0.0 /100 | #327 | Tragic 36.5% |
| Alaskan Athabascans | 0.0 /100 | #328 | Tragic 36.5% |
| Paiute | 0.0 /100 | #329 | Tragic 36.4% |
Demographics Similar to Tohono O'odham by Associate's Degree
In terms of associate's degree, the demographic groups most similar to Tohono O'odham are Yuman (31.3%, a difference of 1.7%), Yakama (32.3%, a difference of 1.7%), Inupiat (32.6%, a difference of 2.5%), Navajo (32.6%, a difference of 2.5%), and Pima (30.2%, a difference of 5.1%).
| Demographics | Rating | Rank | Associate's Degree |
| Mexicans | 0.0 /100 | #333 | Tragic 35.0% |
| Natives/Alaskans | 0.0 /100 | #334 | Tragic 34.9% |
| Spanish American Indians | 0.0 /100 | #335 | Tragic 34.9% |
| Hopi | 0.0 /100 | #336 | Tragic 34.6% |
| Lumbee | 0.0 /100 | #337 | Tragic 34.1% |
| Pueblo | 0.0 /100 | #338 | Tragic 34.0% |
| Immigrants | Mexico | 0.0 /100 | #339 | Tragic 33.7% |
| Navajo | 0.0 /100 | #340 | Tragic 32.6% |
| Inupiat | 0.0 /100 | #341 | Tragic 32.6% |
| Yakama | 0.0 /100 | #342 | Tragic 32.3% |
| Tohono O'odham | 0.0 /100 | #343 | Tragic 31.8% |
| Yuman | 0.0 /100 | #344 | Tragic 31.3% |
| Pima | 0.0 /100 | #345 | Tragic 30.2% |
| Houma | 0.0 /100 | #346 | Tragic 28.2% |
| Yup'ik | 0.0 /100 | #347 | Tragic 25.0% |