Carpatho Rusyn vs Syrian Associate's Degree
COMPARE
Carpatho Rusyn
Syrian
Associate's Degree
Associate's Degree Comparison
Carpatho Rusyns
Syrians
50.6%
ASSOCIATE'S DEGREE
99.3/ 100
METRIC RATING
73rd/ 347
METRIC RANK
49.3%
ASSOCIATE'S DEGREE
96.7/ 100
METRIC RATING
107th/ 347
METRIC RANK
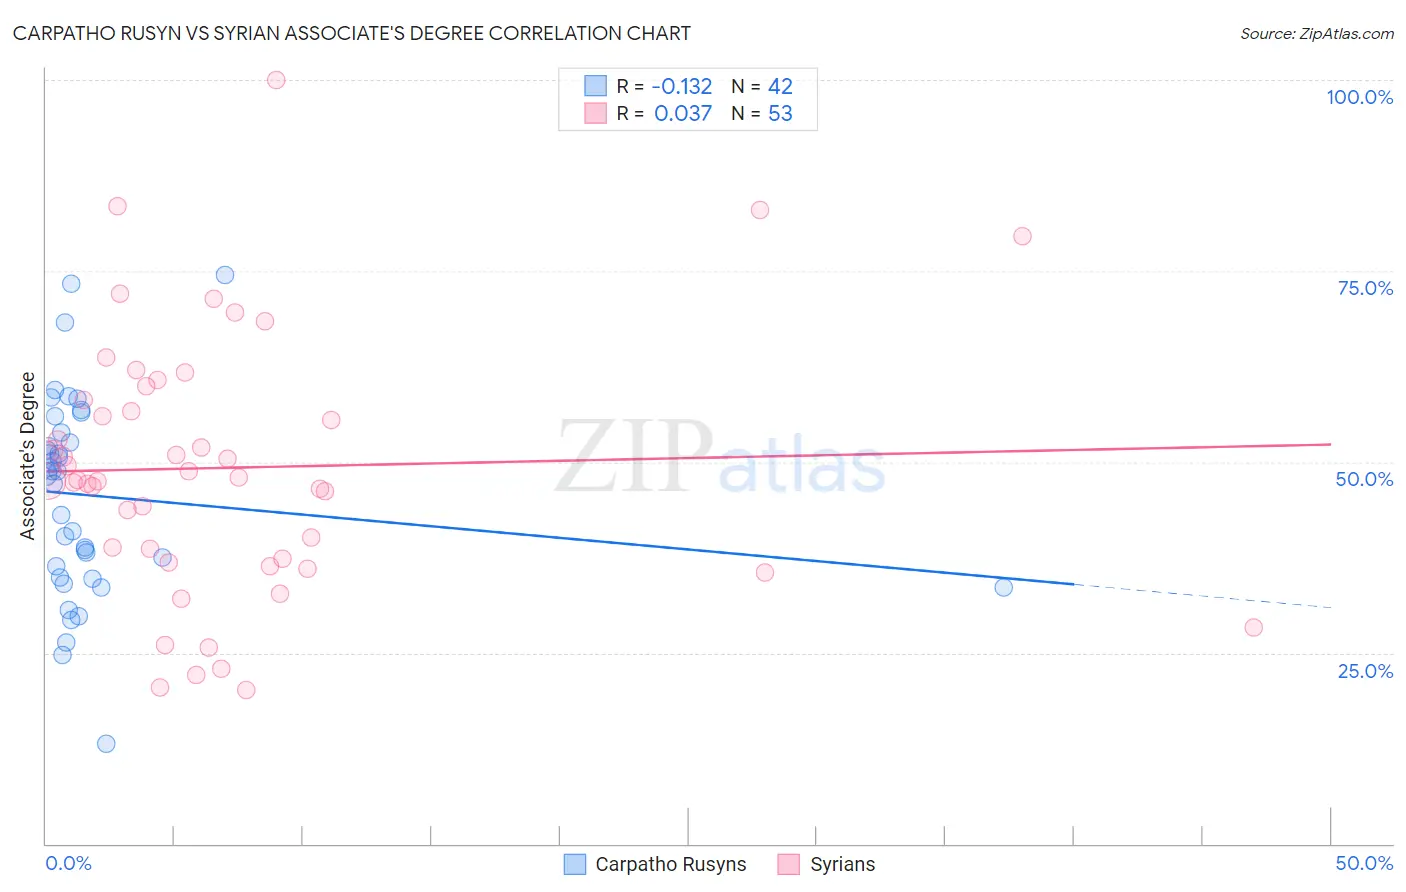
Carpatho Rusyn vs Syrian Associate's Degree Correlation Chart
The statistical analysis conducted on geographies consisting of 58,871,690 people shows a poor negative correlation between the proportion of Carpatho Rusyns and percentage of population with at least associate's degree education in the United States with a correlation coefficient (R) of -0.132 and weighted average of 50.6%. Similarly, the statistical analysis conducted on geographies consisting of 266,303,320 people shows no correlation between the proportion of Syrians and percentage of population with at least associate's degree education in the United States with a correlation coefficient (R) of 0.037 and weighted average of 49.3%, a difference of 2.8%.
Associate's Degree Correlation Summary
| Measurement | Carpatho Rusyn | Syrian |
| Minimum | 13.2% | 20.2% |
| Maximum | 74.4% | 100.0% |
| Range | 61.2% | 79.8% |
| Mean | 45.6% | 49.2% |
| Median | 48.5% | 47.6% |
| Interquartile 25% (IQ1) | 34.9% | 37.1% |
| Interquartile 75% (IQ3) | 53.9% | 59.0% |
| Interquartile Range (IQR) | 19.0% | 21.9% |
| Standard Deviation (Sample) | 13.2% | 17.0% |
| Standard Deviation (Population) | 13.0% | 16.9% |
Similar Demographics by Associate's Degree
Demographics Similar to Carpatho Rusyns by Associate's Degree
In terms of associate's degree, the demographic groups most similar to Carpatho Rusyns are Lithuanian (50.6%, a difference of 0.060%), Immigrants from Scotland (50.6%, a difference of 0.10%), Immigrants from Zimbabwe (50.5%, a difference of 0.31%), Immigrants from Lebanon (50.5%, a difference of 0.34%), and Immigrants from Eastern Europe (50.5%, a difference of 0.38%).
| Demographics | Rating | Rank | Associate's Degree |
| Immigrants | Europe | 99.7 /100 | #66 | Exceptional 51.3% |
| Argentineans | 99.6 /100 | #67 | Exceptional 51.2% |
| Immigrants | Indonesia | 99.5 /100 | #68 | Exceptional 51.0% |
| Egyptians | 99.5 /100 | #69 | Exceptional 50.9% |
| Immigrants | Argentina | 99.5 /100 | #70 | Exceptional 50.9% |
| Immigrants | Romania | 99.5 /100 | #71 | Exceptional 50.9% |
| Immigrants | Pakistan | 99.5 /100 | #72 | Exceptional 50.9% |
| Carpatho Rusyns | 99.3 /100 | #73 | Exceptional 50.6% |
| Lithuanians | 99.3 /100 | #74 | Exceptional 50.6% |
| Immigrants | Scotland | 99.3 /100 | #75 | Exceptional 50.6% |
| Immigrants | Zimbabwe | 99.2 /100 | #76 | Exceptional 50.5% |
| Immigrants | Lebanon | 99.1 /100 | #77 | Exceptional 50.5% |
| Immigrants | Eastern Europe | 99.1 /100 | #78 | Exceptional 50.5% |
| Ethiopians | 99.1 /100 | #79 | Exceptional 50.4% |
| Armenians | 99.1 /100 | #80 | Exceptional 50.4% |
Demographics Similar to Syrians by Associate's Degree
In terms of associate's degree, the demographic groups most similar to Syrians are Croatian (49.3%, a difference of 0.030%), Immigrants from Italy (49.3%, a difference of 0.030%), Jordanian (49.2%, a difference of 0.060%), Venezuelan (49.4%, a difference of 0.18%), and Immigrants from Morocco (49.2%, a difference of 0.20%).
| Demographics | Rating | Rank | Associate's Degree |
| Immigrants | Nepal | 97.5 /100 | #100 | Exceptional 49.5% |
| Northern Europeans | 97.3 /100 | #101 | Exceptional 49.5% |
| Chileans | 97.3 /100 | #102 | Exceptional 49.4% |
| Ukrainians | 97.1 /100 | #103 | Exceptional 49.4% |
| Venezuelans | 97.0 /100 | #104 | Exceptional 49.4% |
| Croatians | 96.8 /100 | #105 | Exceptional 49.3% |
| Immigrants | Italy | 96.7 /100 | #106 | Exceptional 49.3% |
| Syrians | 96.7 /100 | #107 | Exceptional 49.3% |
| Jordanians | 96.6 /100 | #108 | Exceptional 49.2% |
| Immigrants | Morocco | 96.3 /100 | #109 | Exceptional 49.2% |
| Austrians | 95.8 /100 | #110 | Exceptional 49.1% |
| Immigrants | Venezuela | 95.8 /100 | #111 | Exceptional 49.1% |
| Immigrants | Chile | 95.3 /100 | #112 | Exceptional 49.0% |
| Palestinians | 95.3 /100 | #113 | Exceptional 49.0% |
| Arabs | 95.3 /100 | #114 | Exceptional 49.0% |