Immigrants from Uganda vs Syrian Associate's Degree
COMPARE
Immigrants from Uganda
Syrian
Associate's Degree
Associate's Degree Comparison
Immigrants from Uganda
Syrians
48.5%
ASSOCIATE'S DEGREE
92.1/ 100
METRIC RATING
127th/ 347
METRIC RANK
49.3%
ASSOCIATE'S DEGREE
96.7/ 100
METRIC RATING
107th/ 347
METRIC RANK
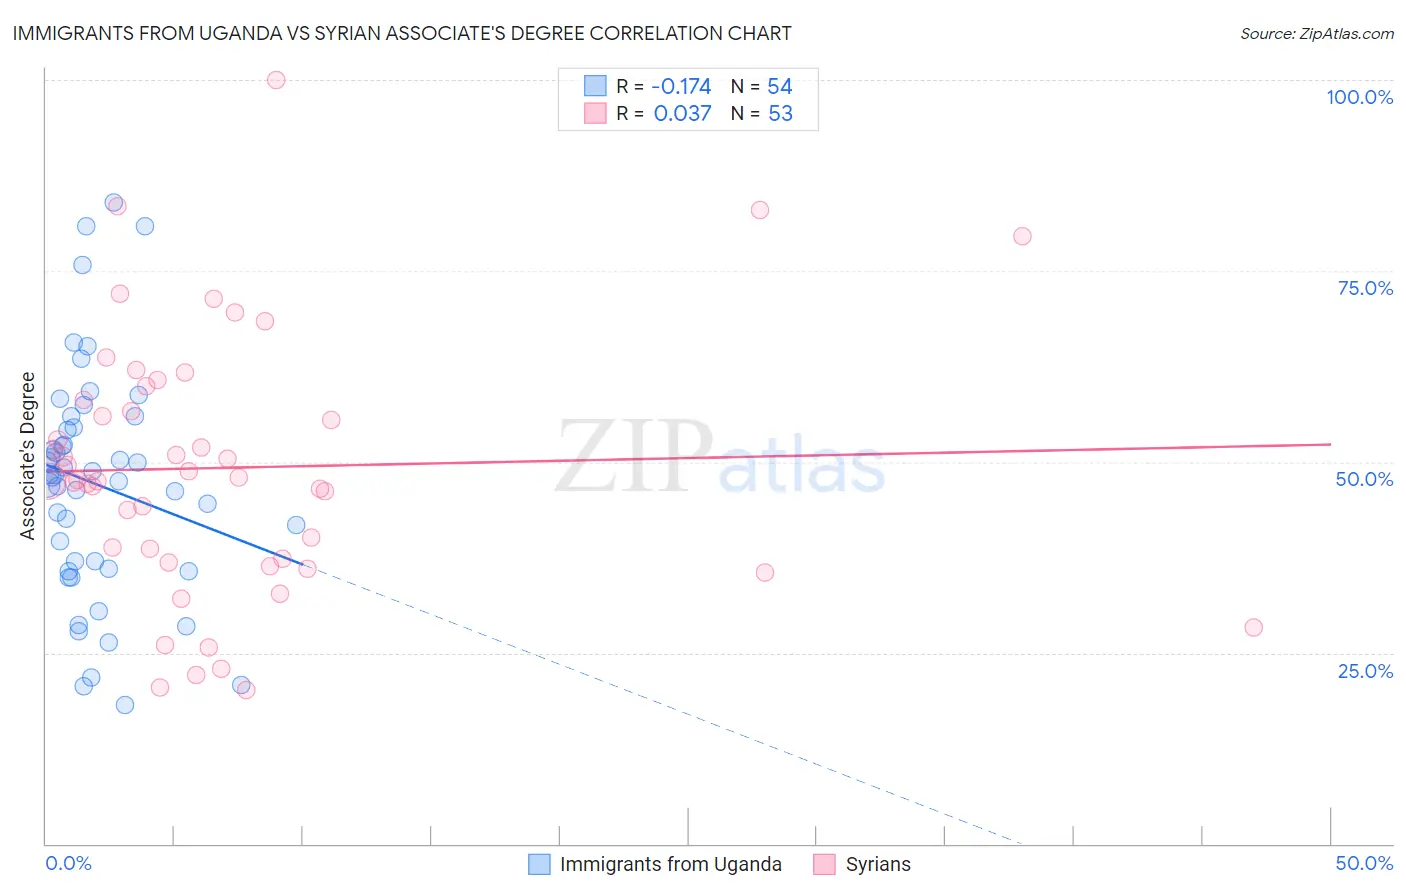
Immigrants from Uganda vs Syrian Associate's Degree Correlation Chart
The statistical analysis conducted on geographies consisting of 125,982,535 people shows a poor negative correlation between the proportion of Immigrants from Uganda and percentage of population with at least associate's degree education in the United States with a correlation coefficient (R) of -0.174 and weighted average of 48.5%. Similarly, the statistical analysis conducted on geographies consisting of 266,303,320 people shows no correlation between the proportion of Syrians and percentage of population with at least associate's degree education in the United States with a correlation coefficient (R) of 0.037 and weighted average of 49.3%, a difference of 1.6%.
Associate's Degree Correlation Summary
| Measurement | Immigrants from Uganda | Syrian |
| Minimum | 18.1% | 20.2% |
| Maximum | 84.0% | 100.0% |
| Range | 65.9% | 79.8% |
| Mean | 47.0% | 49.2% |
| Median | 48.2% | 47.6% |
| Interquartile 25% (IQ1) | 36.0% | 37.1% |
| Interquartile 75% (IQ3) | 54.5% | 59.0% |
| Interquartile Range (IQR) | 18.5% | 21.9% |
| Standard Deviation (Sample) | 15.0% | 17.0% |
| Standard Deviation (Population) | 14.9% | 16.9% |
Demographics Similar to Immigrants from Uganda and Syrians by Associate's Degree
In terms of associate's degree, the demographic groups most similar to Immigrants from Uganda are Immigrants from Syria (48.5%, a difference of 0.010%), Chinese (48.5%, a difference of 0.10%), Serbian (48.5%, a difference of 0.12%), Brazilian (48.7%, a difference of 0.41%), and Ugandan (48.7%, a difference of 0.48%). Similarly, the demographic groups most similar to Syrians are Jordanian (49.2%, a difference of 0.060%), Immigrants from Morocco (49.2%, a difference of 0.20%), Austrian (49.1%, a difference of 0.42%), Immigrants from Venezuela (49.1%, a difference of 0.45%), and Immigrants from Chile (49.0%, a difference of 0.64%).
| Demographics | Rating | Rank | Associate's Degree |
| Syrians | 96.7 /100 | #107 | Exceptional 49.3% |
| Jordanians | 96.6 /100 | #108 | Exceptional 49.2% |
| Immigrants | Morocco | 96.3 /100 | #109 | Exceptional 49.2% |
| Austrians | 95.8 /100 | #110 | Exceptional 49.1% |
| Immigrants | Venezuela | 95.8 /100 | #111 | Exceptional 49.1% |
| Immigrants | Chile | 95.3 /100 | #112 | Exceptional 49.0% |
| Palestinians | 95.3 /100 | #113 | Exceptional 49.0% |
| Arabs | 95.3 /100 | #114 | Exceptional 49.0% |
| Luxembourgers | 95.1 /100 | #115 | Exceptional 48.9% |
| British | 95.0 /100 | #116 | Exceptional 48.9% |
| Afghans | 94.8 /100 | #117 | Exceptional 48.9% |
| Albanians | 94.7 /100 | #118 | Exceptional 48.8% |
| Lebanese | 94.6 /100 | #119 | Exceptional 48.8% |
| Alsatians | 94.6 /100 | #120 | Exceptional 48.8% |
| Ugandans | 93.9 /100 | #121 | Exceptional 48.7% |
| Italians | 93.9 /100 | #122 | Exceptional 48.7% |
| Brazilians | 93.7 /100 | #123 | Exceptional 48.7% |
| Serbians | 92.6 /100 | #124 | Exceptional 48.5% |
| Chinese | 92.5 /100 | #125 | Exceptional 48.5% |
| Immigrants | Syria | 92.2 /100 | #126 | Exceptional 48.5% |
| Immigrants | Uganda | 92.1 /100 | #127 | Exceptional 48.5% |