Japanese vs Immigrants from Argentina College, 1 year or more
COMPARE
Japanese
Immigrants from Argentina
College, 1 year or more
College, 1 year or more Comparison
Japanese
Immigrants from Argentina
55.2%
COLLEGE, 1 YEAR OR MORE
0.5/ 100
METRIC RATING
254th/ 347
METRIC RANK
62.8%
COLLEGE, 1 YEAR OR MORE
98.6/ 100
METRIC RATING
83rd/ 347
METRIC RANK
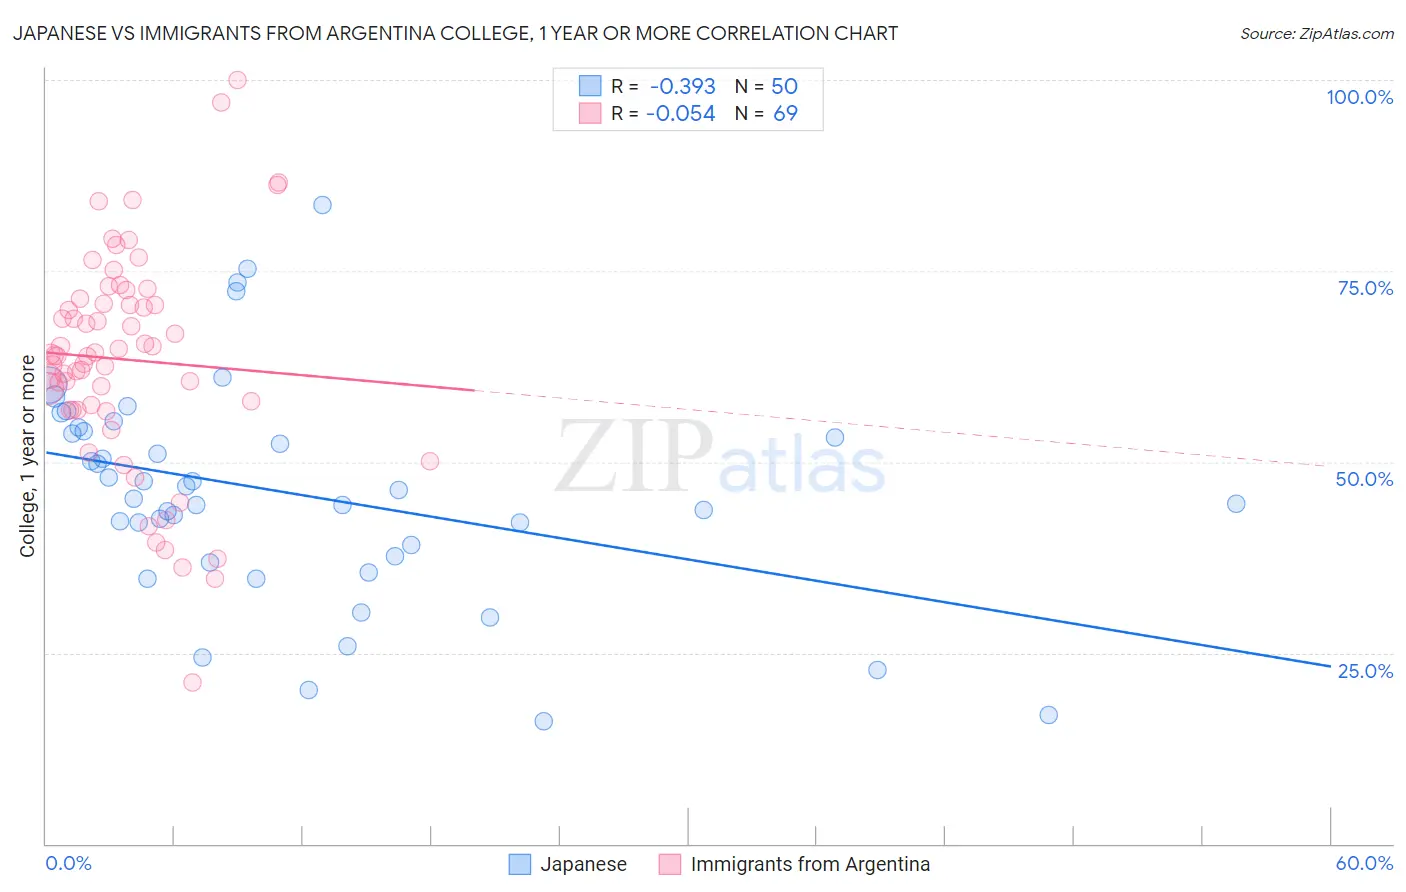
Japanese vs Immigrants from Argentina College, 1 year or more Correlation Chart
The statistical analysis conducted on geographies consisting of 249,181,552 people shows a mild negative correlation between the proportion of Japanese and percentage of population with at least college, 1 year or more education in the United States with a correlation coefficient (R) of -0.393 and weighted average of 55.2%. Similarly, the statistical analysis conducted on geographies consisting of 264,437,906 people shows a slight negative correlation between the proportion of Immigrants from Argentina and percentage of population with at least college, 1 year or more education in the United States with a correlation coefficient (R) of -0.054 and weighted average of 62.8%, a difference of 13.7%.
College, 1 year or more Correlation Summary
| Measurement | Japanese | Immigrants from Argentina |
| Minimum | 16.1% | 21.0% |
| Maximum | 83.7% | 100.0% |
| Range | 67.6% | 79.0% |
| Mean | 45.9% | 63.4% |
| Median | 45.8% | 64.0% |
| Interquartile 25% (IQ1) | 37.6% | 56.8% |
| Interquartile 75% (IQ3) | 54.1% | 71.0% |
| Interquartile Range (IQR) | 16.5% | 14.2% |
| Standard Deviation (Sample) | 14.4% | 14.4% |
| Standard Deviation (Population) | 14.2% | 14.3% |
Similar Demographics by College, 1 year or more
Demographics Similar to Japanese by College, 1 year or more
In terms of college, 1 year or more, the demographic groups most similar to Japanese are Immigrants from Bahamas (55.2%, a difference of 0.050%), Immigrants from West Indies (55.2%, a difference of 0.12%), Indonesian (55.1%, a difference of 0.22%), Immigrants from Barbados (55.4%, a difference of 0.25%), and Aleut (55.4%, a difference of 0.36%).
| Demographics | Rating | Rank | College, 1 year or more |
| Hawaiians | 0.8 /100 | #247 | Tragic 55.6% |
| Immigrants | Congo | 0.8 /100 | #248 | Tragic 55.6% |
| Immigrants | Trinidad and Tobago | 0.7 /100 | #249 | Tragic 55.5% |
| Delaware | 0.7 /100 | #250 | Tragic 55.5% |
| Immigrants | Cambodia | 0.6 /100 | #251 | Tragic 55.4% |
| Aleuts | 0.6 /100 | #252 | Tragic 55.4% |
| Immigrants | Barbados | 0.6 /100 | #253 | Tragic 55.4% |
| Japanese | 0.5 /100 | #254 | Tragic 55.2% |
| Immigrants | Bahamas | 0.5 /100 | #255 | Tragic 55.2% |
| Immigrants | West Indies | 0.5 /100 | #256 | Tragic 55.2% |
| Indonesians | 0.4 /100 | #257 | Tragic 55.1% |
| Africans | 0.4 /100 | #258 | Tragic 55.0% |
| Nepalese | 0.3 /100 | #259 | Tragic 54.9% |
| Jamaicans | 0.3 /100 | #260 | Tragic 54.9% |
| Ottawa | 0.3 /100 | #261 | Tragic 54.9% |
Demographics Similar to Immigrants from Argentina by College, 1 year or more
In terms of college, 1 year or more, the demographic groups most similar to Immigrants from Argentina are Immigrants from England (62.8%, a difference of 0.030%), Immigrants from Bolivia (62.8%, a difference of 0.040%), Immigrants from Pakistan (62.8%, a difference of 0.040%), Immigrants from Western Europe (62.7%, a difference of 0.060%), and Laotian (62.8%, a difference of 0.080%).
| Demographics | Rating | Rank | College, 1 year or more |
| Paraguayans | 98.8 /100 | #76 | Exceptional 62.9% |
| Ethiopians | 98.8 /100 | #77 | Exceptional 62.9% |
| Immigrants | Lebanon | 98.8 /100 | #78 | Exceptional 62.9% |
| Northern Europeans | 98.8 /100 | #79 | Exceptional 62.9% |
| Lithuanians | 98.8 /100 | #80 | Exceptional 62.9% |
| Laotians | 98.7 /100 | #81 | Exceptional 62.8% |
| Immigrants | Bolivia | 98.7 /100 | #82 | Exceptional 62.8% |
| Immigrants | Argentina | 98.6 /100 | #83 | Exceptional 62.8% |
| Immigrants | England | 98.6 /100 | #84 | Exceptional 62.8% |
| Immigrants | Pakistan | 98.6 /100 | #85 | Exceptional 62.8% |
| Immigrants | Western Europe | 98.6 /100 | #86 | Exceptional 62.7% |
| Immigrants | Hungary | 98.6 /100 | #87 | Exceptional 62.7% |
| Greeks | 98.3 /100 | #88 | Exceptional 62.6% |
| Immigrants | Ethiopia | 98.2 /100 | #89 | Exceptional 62.6% |
| Immigrants | Western Asia | 97.9 /100 | #90 | Exceptional 62.5% |