Jamaican vs Immigrants from China Professional Degree
COMPARE
Jamaican
Immigrants from China
Professional Degree
Professional Degree Comparison
Jamaicans
Immigrants from China
3.7%
PROFESSIONAL DEGREE
1.4/ 100
METRIC RATING
252nd/ 347
METRIC RANK
6.7%
PROFESSIONAL DEGREE
100.0/ 100
METRIC RATING
15th/ 347
METRIC RANK
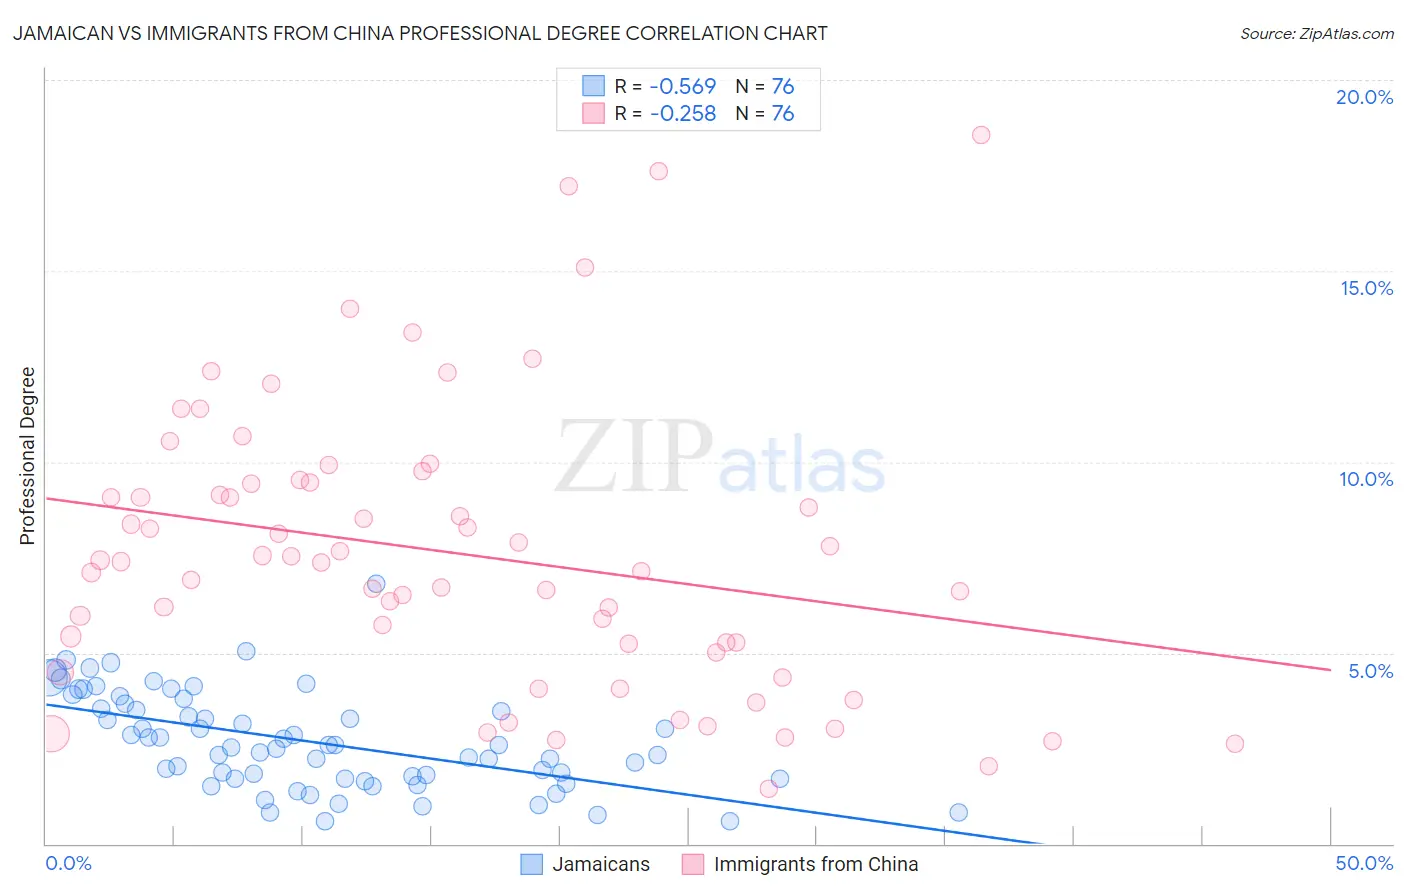
Jamaican vs Immigrants from China Professional Degree Correlation Chart
The statistical analysis conducted on geographies consisting of 367,101,955 people shows a substantial negative correlation between the proportion of Jamaicans and percentage of population with at least professional degree education in the United States with a correlation coefficient (R) of -0.569 and weighted average of 3.7%. Similarly, the statistical analysis conducted on geographies consisting of 455,966,204 people shows a weak negative correlation between the proportion of Immigrants from China and percentage of population with at least professional degree education in the United States with a correlation coefficient (R) of -0.258 and weighted average of 6.7%, a difference of 80.7%.
Professional Degree Correlation Summary
| Measurement | Jamaican | Immigrants from China |
| Minimum | 0.59% | 1.4% |
| Maximum | 6.8% | 18.6% |
| Range | 6.2% | 17.1% |
| Mean | 2.7% | 7.6% |
| Median | 2.5% | 7.4% |
| Interquartile 25% (IQ1) | 1.7% | 5.1% |
| Interquartile 75% (IQ3) | 3.6% | 9.5% |
| Interquartile Range (IQR) | 1.9% | 4.3% |
| Standard Deviation (Sample) | 1.3% | 3.7% |
| Standard Deviation (Population) | 1.3% | 3.7% |
Similar Demographics by Professional Degree
Demographics Similar to Jamaicans by Professional Degree
In terms of professional degree, the demographic groups most similar to Jamaicans are Pueblo (3.7%, a difference of 0.10%), Immigrants from Nicaragua (3.7%, a difference of 0.14%), Tongan (3.7%, a difference of 0.24%), Immigrants from Fiji (3.7%, a difference of 0.39%), and Immigrants from Grenada (3.7%, a difference of 0.46%).
| Demographics | Rating | Rank | Professional Degree |
| French American Indians | 1.7 /100 | #245 | Tragic 3.8% |
| Marshallese | 1.7 /100 | #246 | Tragic 3.8% |
| Guyanese | 1.6 /100 | #247 | Tragic 3.8% |
| Hmong | 1.6 /100 | #248 | Tragic 3.7% |
| Immigrants | Grenada | 1.5 /100 | #249 | Tragic 3.7% |
| Immigrants | Fiji | 1.5 /100 | #250 | Tragic 3.7% |
| Immigrants | Nicaragua | 1.4 /100 | #251 | Tragic 3.7% |
| Jamaicans | 1.4 /100 | #252 | Tragic 3.7% |
| Pueblo | 1.4 /100 | #253 | Tragic 3.7% |
| Tongans | 1.3 /100 | #254 | Tragic 3.7% |
| Osage | 1.2 /100 | #255 | Tragic 3.7% |
| Iroquois | 1.2 /100 | #256 | Tragic 3.7% |
| Bahamians | 1.1 /100 | #257 | Tragic 3.7% |
| Immigrants | St. Vincent and the Grenadines | 1.1 /100 | #258 | Tragic 3.7% |
| Africans | 1.0 /100 | #259 | Tragic 3.7% |
Demographics Similar to Immigrants from China by Professional Degree
In terms of professional degree, the demographic groups most similar to Immigrants from China are Immigrants from Sweden (6.7%, a difference of 0.45%), Immigrants from France (6.8%, a difference of 1.1%), Immigrants from Eastern Asia (6.6%, a difference of 2.5%), Soviet Union (6.6%, a difference of 2.5%), and Immigrants from Australia (6.9%, a difference of 2.6%).
| Demographics | Rating | Rank | Professional Degree |
| Immigrants | Switzerland | 100.0 /100 | #8 | Exceptional 7.1% |
| Immigrants | Taiwan | 100.0 /100 | #9 | Exceptional 7.1% |
| Immigrants | Belgium | 100.0 /100 | #10 | Exceptional 7.0% |
| Cypriots | 100.0 /100 | #11 | Exceptional 6.9% |
| Israelis | 100.0 /100 | #12 | Exceptional 6.9% |
| Immigrants | Australia | 100.0 /100 | #13 | Exceptional 6.9% |
| Immigrants | France | 100.0 /100 | #14 | Exceptional 6.8% |
| Immigrants | China | 100.0 /100 | #15 | Exceptional 6.7% |
| Immigrants | Sweden | 100.0 /100 | #16 | Exceptional 6.7% |
| Immigrants | Eastern Asia | 100.0 /100 | #17 | Exceptional 6.6% |
| Soviet Union | 100.0 /100 | #18 | Exceptional 6.6% |
| Indians (Asian) | 100.0 /100 | #19 | Exceptional 6.5% |
| Immigrants | Denmark | 100.0 /100 | #20 | Exceptional 6.4% |
| Immigrants | Hong Kong | 100.0 /100 | #21 | Exceptional 6.4% |
| Immigrants | Japan | 100.0 /100 | #22 | Exceptional 6.4% |