Navajo vs Immigrants from Lithuania Professional Degree
COMPARE
Navajo
Immigrants from Lithuania
Professional Degree
Professional Degree Comparison
Navajo
Immigrants from Lithuania
2.9%
PROFESSIONAL DEGREE
0.0/ 100
METRIC RATING
338th/ 347
METRIC RANK
5.6%
PROFESSIONAL DEGREE
99.9/ 100
METRIC RATING
61st/ 347
METRIC RANK
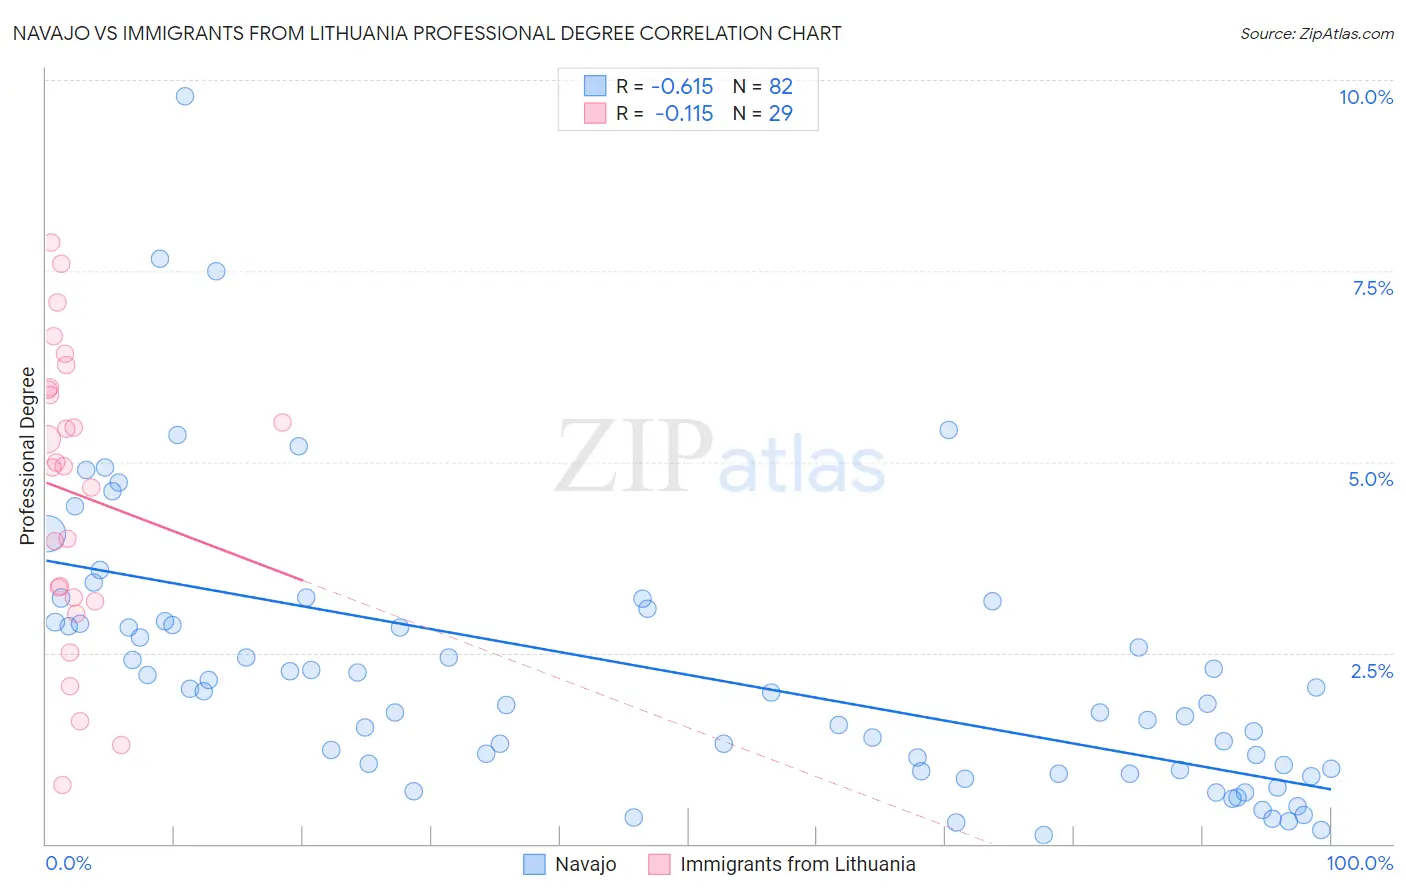
Navajo vs Immigrants from Lithuania Professional Degree Correlation Chart
The statistical analysis conducted on geographies consisting of 224,034,361 people shows a significant negative correlation between the proportion of Navajo and percentage of population with at least professional degree education in the United States with a correlation coefficient (R) of -0.615 and weighted average of 2.9%. Similarly, the statistical analysis conducted on geographies consisting of 117,699,727 people shows a poor negative correlation between the proportion of Immigrants from Lithuania and percentage of population with at least professional degree education in the United States with a correlation coefficient (R) of -0.115 and weighted average of 5.6%, a difference of 94.0%.
Professional Degree Correlation Summary
| Measurement | Navajo | Immigrants from Lithuania |
| Minimum | 0.11% | 0.77% |
| Maximum | 9.8% | 7.9% |
| Range | 9.7% | 7.1% |
| Mean | 2.3% | 4.6% |
| Median | 1.9% | 4.9% |
| Interquartile 25% (IQ1) | 0.96% | 3.2% |
| Interquartile 75% (IQ3) | 2.9% | 6.0% |
| Interquartile Range (IQR) | 1.9% | 2.8% |
| Standard Deviation (Sample) | 1.8% | 1.9% |
| Standard Deviation (Population) | 1.8% | 1.9% |
Similar Demographics by Professional Degree
Demographics Similar to Navajo by Professional Degree
In terms of professional degree, the demographic groups most similar to Navajo are Arapaho (2.9%, a difference of 0.070%), Immigrants from Central America (2.9%, a difference of 0.12%), Yup'ik (2.9%, a difference of 0.17%), Tohono O'odham (2.8%, a difference of 0.95%), and Immigrants from the Azores (2.8%, a difference of 1.6%).
| Demographics | Rating | Rank | Professional Degree |
| Kiowa | 0.0 /100 | #331 | Tragic 3.1% |
| Yakama | 0.0 /100 | #332 | Tragic 3.1% |
| Puget Sound Salish | 0.0 /100 | #333 | Tragic 3.1% |
| Pennsylvania Germans | 0.0 /100 | #334 | Tragic 3.0% |
| Natives/Alaskans | 0.0 /100 | #335 | Tragic 3.0% |
| Fijians | 0.0 /100 | #336 | Tragic 2.9% |
| Arapaho | 0.0 /100 | #337 | Tragic 2.9% |
| Navajo | 0.0 /100 | #338 | Tragic 2.9% |
| Immigrants | Central America | 0.0 /100 | #339 | Tragic 2.9% |
| Yup'ik | 0.0 /100 | #340 | Tragic 2.9% |
| Tohono O'odham | 0.0 /100 | #341 | Tragic 2.8% |
| Immigrants | Azores | 0.0 /100 | #342 | Tragic 2.8% |
| Mexicans | 0.0 /100 | #343 | Tragic 2.7% |
| Spanish American Indians | 0.0 /100 | #344 | Tragic 2.7% |
| Immigrants | Mexico | 0.0 /100 | #345 | Tragic 2.6% |
Demographics Similar to Immigrants from Lithuania by Professional Degree
In terms of professional degree, the demographic groups most similar to Immigrants from Lithuania are Bolivian (5.6%, a difference of 0.65%), Immigrants from Belarus (5.5%, a difference of 0.76%), Immigrants from Europe (5.6%, a difference of 1.1%), Asian (5.5%, a difference of 1.2%), and Immigrants from Asia (5.5%, a difference of 1.3%).
| Demographics | Rating | Rank | Professional Degree |
| Immigrants | Kuwait | 100.0 /100 | #54 | Exceptional 5.7% |
| Immigrants | Western Europe | 100.0 /100 | #55 | Exceptional 5.7% |
| Immigrants | Malaysia | 100.0 /100 | #56 | Exceptional 5.7% |
| South Africans | 100.0 /100 | #57 | Exceptional 5.7% |
| Bulgarians | 100.0 /100 | #58 | Exceptional 5.7% |
| Immigrants | Europe | 100.0 /100 | #59 | Exceptional 5.6% |
| Bolivians | 99.9 /100 | #60 | Exceptional 5.6% |
| Immigrants | Lithuania | 99.9 /100 | #61 | Exceptional 5.6% |
| Immigrants | Belarus | 99.9 /100 | #62 | Exceptional 5.5% |
| Asians | 99.9 /100 | #63 | Exceptional 5.5% |
| Immigrants | Asia | 99.9 /100 | #64 | Exceptional 5.5% |
| Immigrants | Bolivia | 99.9 /100 | #65 | Exceptional 5.5% |
| Immigrants | Kazakhstan | 99.9 /100 | #66 | Exceptional 5.5% |
| Immigrants | Bulgaria | 99.9 /100 | #67 | Exceptional 5.5% |
| Immigrants | Lebanon | 99.9 /100 | #68 | Exceptional 5.5% |