Jamaican vs Cuban Professional Degree
COMPARE
Jamaican
Cuban
Professional Degree
Professional Degree Comparison
Jamaicans
Cubans
3.7%
PROFESSIONAL DEGREE
1.4/ 100
METRIC RATING
252nd/ 347
METRIC RANK
4.0%
PROFESSIONAL DEGREE
5.9/ 100
METRIC RATING
227th/ 347
METRIC RANK
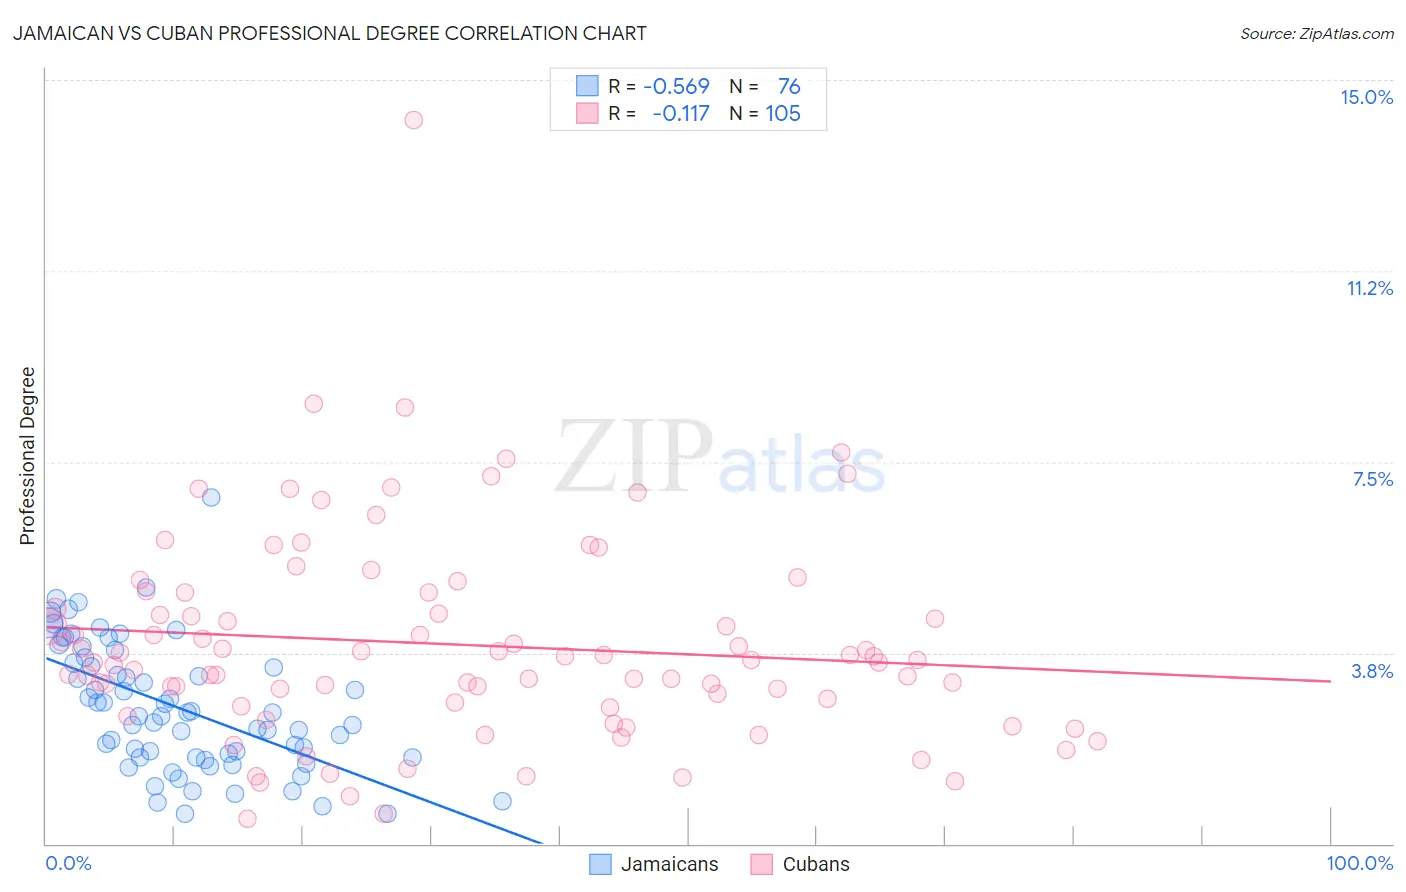
Jamaican vs Cuban Professional Degree Correlation Chart
The statistical analysis conducted on geographies consisting of 367,101,955 people shows a substantial negative correlation between the proportion of Jamaicans and percentage of population with at least professional degree education in the United States with a correlation coefficient (R) of -0.569 and weighted average of 3.7%. Similarly, the statistical analysis conducted on geographies consisting of 447,765,815 people shows a poor negative correlation between the proportion of Cubans and percentage of population with at least professional degree education in the United States with a correlation coefficient (R) of -0.117 and weighted average of 4.0%, a difference of 6.4%.
Professional Degree Correlation Summary
| Measurement | Jamaican | Cuban |
| Minimum | 0.59% | 0.48% |
| Maximum | 6.8% | 14.2% |
| Range | 6.2% | 13.7% |
| Mean | 2.7% | 3.9% |
| Median | 2.5% | 3.6% |
| Interquartile 25% (IQ1) | 1.7% | 2.7% |
| Interquartile 75% (IQ3) | 3.6% | 4.8% |
| Interquartile Range (IQR) | 1.9% | 2.0% |
| Standard Deviation (Sample) | 1.3% | 2.0% |
| Standard Deviation (Population) | 1.3% | 2.0% |
Similar Demographics by Professional Degree
Demographics Similar to Jamaicans by Professional Degree
In terms of professional degree, the demographic groups most similar to Jamaicans are Pueblo (3.7%, a difference of 0.10%), Immigrants from Nicaragua (3.7%, a difference of 0.14%), Tongan (3.7%, a difference of 0.24%), Immigrants from Fiji (3.7%, a difference of 0.39%), and Immigrants from Grenada (3.7%, a difference of 0.46%).
| Demographics | Rating | Rank | Professional Degree |
| French American Indians | 1.7 /100 | #245 | Tragic 3.8% |
| Marshallese | 1.7 /100 | #246 | Tragic 3.8% |
| Guyanese | 1.6 /100 | #247 | Tragic 3.8% |
| Hmong | 1.6 /100 | #248 | Tragic 3.7% |
| Immigrants | Grenada | 1.5 /100 | #249 | Tragic 3.7% |
| Immigrants | Fiji | 1.5 /100 | #250 | Tragic 3.7% |
| Immigrants | Nicaragua | 1.4 /100 | #251 | Tragic 3.7% |
| Jamaicans | 1.4 /100 | #252 | Tragic 3.7% |
| Pueblo | 1.4 /100 | #253 | Tragic 3.7% |
| Tongans | 1.3 /100 | #254 | Tragic 3.7% |
| Osage | 1.2 /100 | #255 | Tragic 3.7% |
| Iroquois | 1.2 /100 | #256 | Tragic 3.7% |
| Bahamians | 1.1 /100 | #257 | Tragic 3.7% |
| Immigrants | St. Vincent and the Grenadines | 1.1 /100 | #258 | Tragic 3.7% |
| Africans | 1.0 /100 | #259 | Tragic 3.7% |
Demographics Similar to Cubans by Professional Degree
In terms of professional degree, the demographic groups most similar to Cubans are German Russian (4.0%, a difference of 0.12%), Immigrants from West Indies (4.0%, a difference of 0.25%), Immigrants from Burma/Myanmar (3.9%, a difference of 0.39%), Nicaraguan (3.9%, a difference of 0.67%), and Tlingit-Haida (4.0%, a difference of 0.68%).
| Demographics | Rating | Rank | Professional Degree |
| Ute | 8.2 /100 | #220 | Tragic 4.0% |
| French Canadians | 8.0 /100 | #221 | Tragic 4.0% |
| Immigrants | Western Africa | 7.5 /100 | #222 | Tragic 4.0% |
| Immigrants | Bosnia and Herzegovina | 7.4 /100 | #223 | Tragic 4.0% |
| Trinidadians and Tobagonians | 7.1 /100 | #224 | Tragic 4.0% |
| Tlingit-Haida | 6.9 /100 | #225 | Tragic 4.0% |
| German Russians | 6.1 /100 | #226 | Tragic 4.0% |
| Cubans | 5.9 /100 | #227 | Tragic 4.0% |
| Immigrants | West Indies | 5.6 /100 | #228 | Tragic 4.0% |
| Immigrants | Burma/Myanmar | 5.4 /100 | #229 | Tragic 3.9% |
| Nicaraguans | 5.1 /100 | #230 | Tragic 3.9% |
| Ecuadorians | 4.6 /100 | #231 | Tragic 3.9% |
| Cree | 4.3 /100 | #232 | Tragic 3.9% |
| Immigrants | Philippines | 4.1 /100 | #233 | Tragic 3.9% |
| Immigrants | Nonimmigrants | 4.0 /100 | #234 | Tragic 3.9% |