Japanese vs Immigrants from Lithuania Professional Degree
COMPARE
Japanese
Immigrants from Lithuania
Professional Degree
Professional Degree Comparison
Japanese
Immigrants from Lithuania
3.5%
PROFESSIONAL DEGREE
0.5/ 100
METRIC RATING
278th/ 347
METRIC RANK
5.6%
PROFESSIONAL DEGREE
99.9/ 100
METRIC RATING
61st/ 347
METRIC RANK
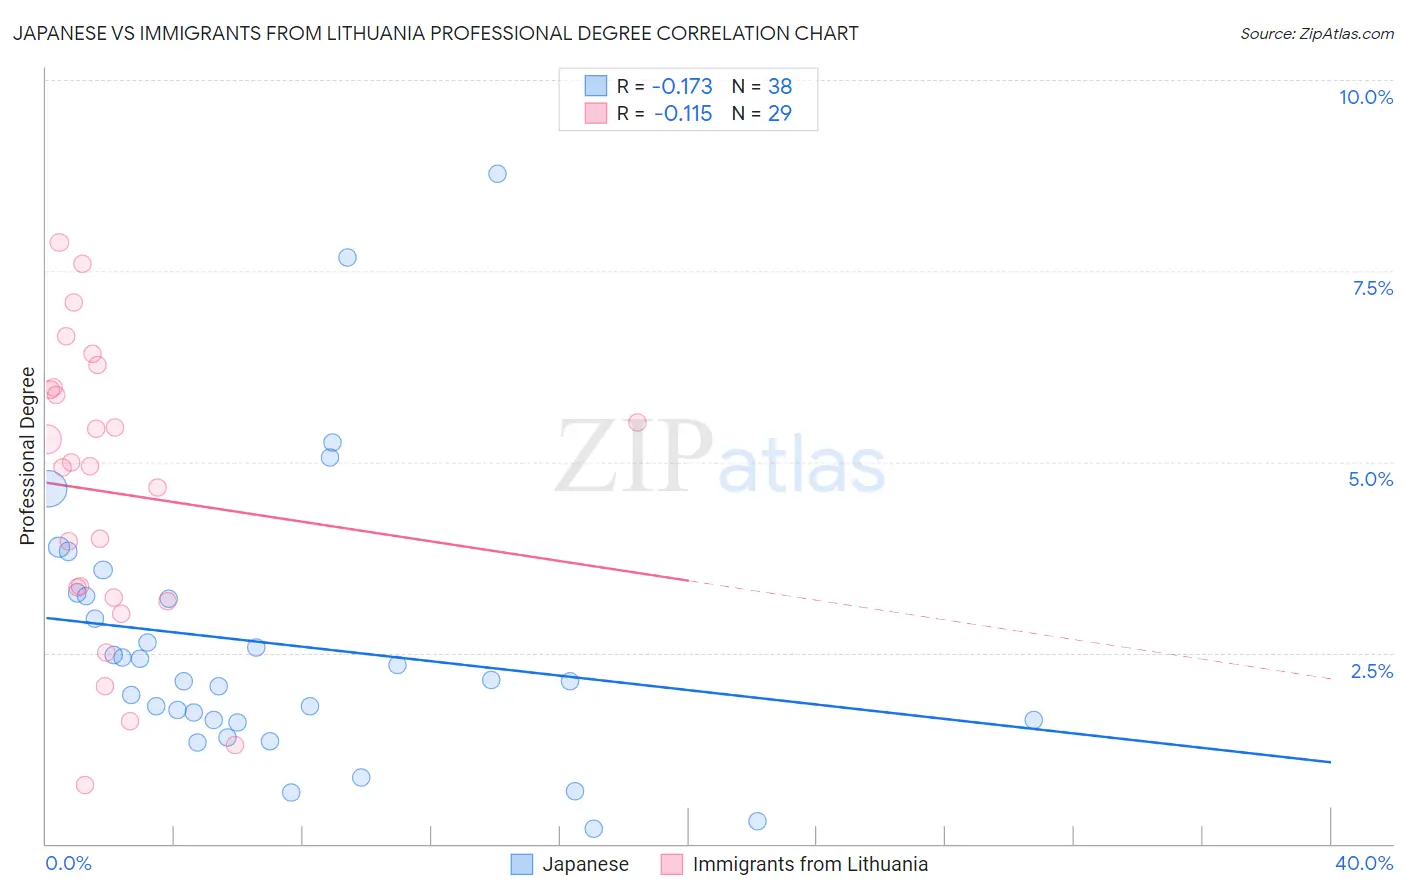
Japanese vs Immigrants from Lithuania Professional Degree Correlation Chart
The statistical analysis conducted on geographies consisting of 248,858,798 people shows a poor negative correlation between the proportion of Japanese and percentage of population with at least professional degree education in the United States with a correlation coefficient (R) of -0.173 and weighted average of 3.5%. Similarly, the statistical analysis conducted on geographies consisting of 117,699,727 people shows a poor negative correlation between the proportion of Immigrants from Lithuania and percentage of population with at least professional degree education in the United States with a correlation coefficient (R) of -0.115 and weighted average of 5.6%, a difference of 57.1%.
Professional Degree Correlation Summary
| Measurement | Japanese | Immigrants from Lithuania |
| Minimum | 0.20% | 0.77% |
| Maximum | 8.8% | 7.9% |
| Range | 8.6% | 7.1% |
| Mean | 2.6% | 4.6% |
| Median | 2.1% | 4.9% |
| Interquartile 25% (IQ1) | 1.6% | 3.2% |
| Interquartile 75% (IQ3) | 3.2% | 6.0% |
| Interquartile Range (IQR) | 1.6% | 2.8% |
| Standard Deviation (Sample) | 1.8% | 1.9% |
| Standard Deviation (Population) | 1.8% | 1.9% |
Similar Demographics by Professional Degree
Demographics Similar to Japanese by Professional Degree
In terms of professional degree, the demographic groups most similar to Japanese are Immigrants from Portugal (3.5%, a difference of 0.040%), Cheyenne (3.6%, a difference of 0.060%), Liberian (3.6%, a difference of 0.070%), Dominican (3.5%, a difference of 0.080%), and Apache (3.5%, a difference of 0.10%).
| Demographics | Rating | Rank | Professional Degree |
| Belizeans | 0.5 /100 | #271 | Tragic 3.6% |
| Immigrants | Jamaica | 0.5 /100 | #272 | Tragic 3.6% |
| Americans | 0.5 /100 | #273 | Tragic 3.6% |
| Potawatomi | 0.5 /100 | #274 | Tragic 3.6% |
| Immigrants | Dominica | 0.5 /100 | #275 | Tragic 3.6% |
| Liberians | 0.5 /100 | #276 | Tragic 3.6% |
| Cheyenne | 0.5 /100 | #277 | Tragic 3.6% |
| Japanese | 0.5 /100 | #278 | Tragic 3.5% |
| Immigrants | Portugal | 0.5 /100 | #279 | Tragic 3.5% |
| Dominicans | 0.5 /100 | #280 | Tragic 3.5% |
| Apache | 0.5 /100 | #281 | Tragic 3.5% |
| Immigrants | Caribbean | 0.5 /100 | #282 | Tragic 3.5% |
| Comanche | 0.4 /100 | #283 | Tragic 3.5% |
| Salvadorans | 0.4 /100 | #284 | Tragic 3.5% |
| Hondurans | 0.3 /100 | #285 | Tragic 3.5% |
Demographics Similar to Immigrants from Lithuania by Professional Degree
In terms of professional degree, the demographic groups most similar to Immigrants from Lithuania are Bolivian (5.6%, a difference of 0.65%), Immigrants from Belarus (5.5%, a difference of 0.76%), Immigrants from Europe (5.6%, a difference of 1.1%), Asian (5.5%, a difference of 1.2%), and Immigrants from Asia (5.5%, a difference of 1.3%).
| Demographics | Rating | Rank | Professional Degree |
| Immigrants | Kuwait | 100.0 /100 | #54 | Exceptional 5.7% |
| Immigrants | Western Europe | 100.0 /100 | #55 | Exceptional 5.7% |
| Immigrants | Malaysia | 100.0 /100 | #56 | Exceptional 5.7% |
| South Africans | 100.0 /100 | #57 | Exceptional 5.7% |
| Bulgarians | 100.0 /100 | #58 | Exceptional 5.7% |
| Immigrants | Europe | 100.0 /100 | #59 | Exceptional 5.6% |
| Bolivians | 99.9 /100 | #60 | Exceptional 5.6% |
| Immigrants | Lithuania | 99.9 /100 | #61 | Exceptional 5.6% |
| Immigrants | Belarus | 99.9 /100 | #62 | Exceptional 5.5% |
| Asians | 99.9 /100 | #63 | Exceptional 5.5% |
| Immigrants | Asia | 99.9 /100 | #64 | Exceptional 5.5% |
| Immigrants | Bolivia | 99.9 /100 | #65 | Exceptional 5.5% |
| Immigrants | Kazakhstan | 99.9 /100 | #66 | Exceptional 5.5% |
| Immigrants | Bulgaria | 99.9 /100 | #67 | Exceptional 5.5% |
| Immigrants | Lebanon | 99.9 /100 | #68 | Exceptional 5.5% |