Jamaican vs Immigrants from Eastern Africa Professional Degree
COMPARE
Jamaican
Immigrants from Eastern Africa
Professional Degree
Professional Degree Comparison
Jamaicans
Immigrants from Eastern Africa
3.7%
PROFESSIONAL DEGREE
1.4/ 100
METRIC RATING
252nd/ 347
METRIC RANK
4.8%
PROFESSIONAL DEGREE
92.5/ 100
METRIC RATING
128th/ 347
METRIC RANK
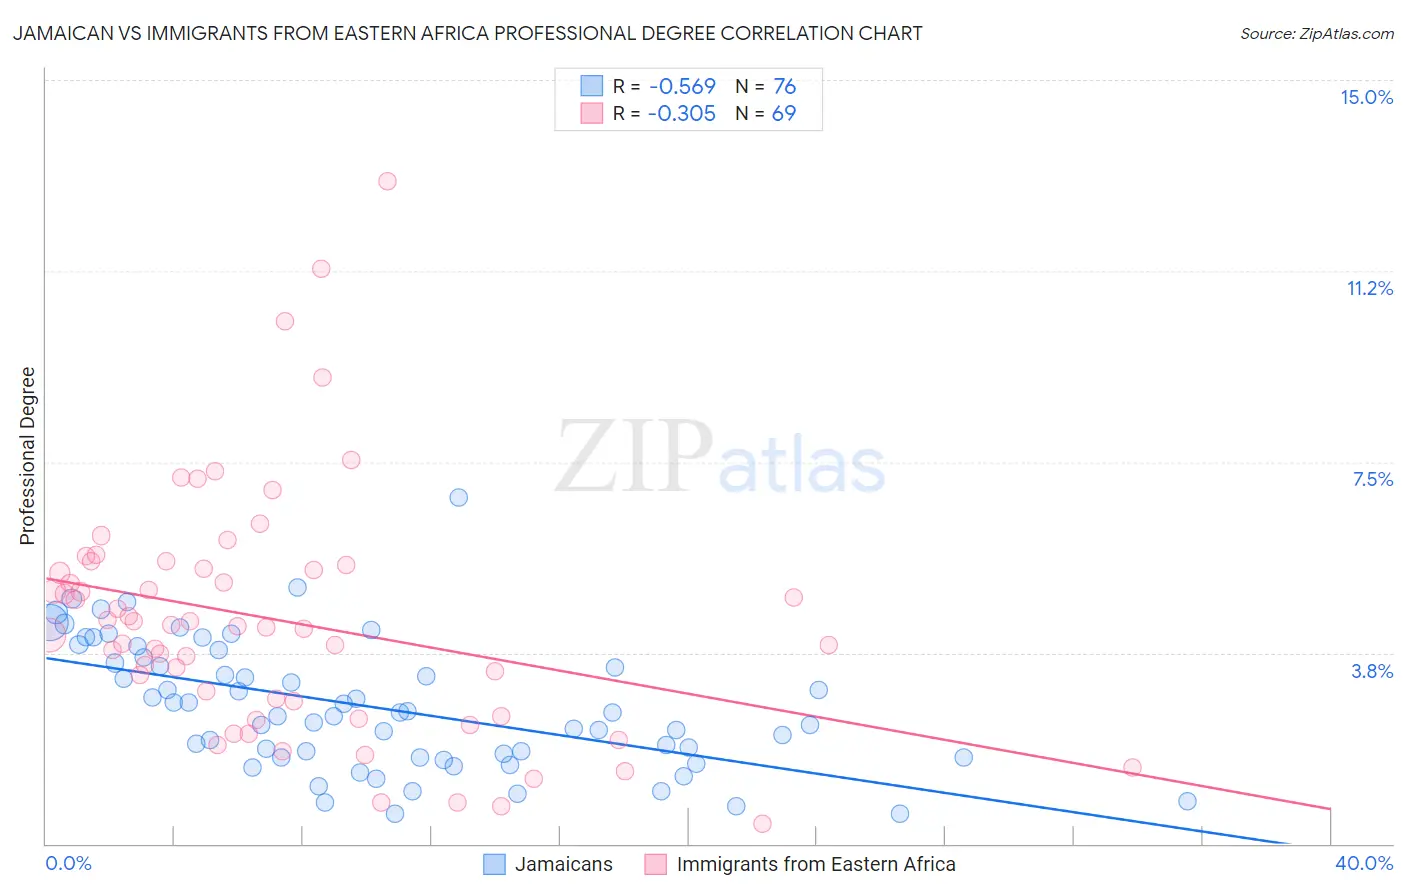
Jamaican vs Immigrants from Eastern Africa Professional Degree Correlation Chart
The statistical analysis conducted on geographies consisting of 367,101,955 people shows a substantial negative correlation between the proportion of Jamaicans and percentage of population with at least professional degree education in the United States with a correlation coefficient (R) of -0.569 and weighted average of 3.7%. Similarly, the statistical analysis conducted on geographies consisting of 354,533,484 people shows a mild negative correlation between the proportion of Immigrants from Eastern Africa and percentage of population with at least professional degree education in the United States with a correlation coefficient (R) of -0.305 and weighted average of 4.8%, a difference of 29.1%.
Professional Degree Correlation Summary
| Measurement | Jamaican | Immigrants from Eastern Africa |
| Minimum | 0.59% | 0.40% |
| Maximum | 6.8% | 13.0% |
| Range | 6.2% | 12.6% |
| Mean | 2.7% | 4.4% |
| Median | 2.5% | 4.3% |
| Interquartile 25% (IQ1) | 1.7% | 2.7% |
| Interquartile 75% (IQ3) | 3.6% | 5.4% |
| Interquartile Range (IQR) | 1.9% | 2.8% |
| Standard Deviation (Sample) | 1.3% | 2.4% |
| Standard Deviation (Population) | 1.3% | 2.4% |
Similar Demographics by Professional Degree
Demographics Similar to Jamaicans by Professional Degree
In terms of professional degree, the demographic groups most similar to Jamaicans are Pueblo (3.7%, a difference of 0.10%), Immigrants from Nicaragua (3.7%, a difference of 0.14%), Tongan (3.7%, a difference of 0.24%), Immigrants from Fiji (3.7%, a difference of 0.39%), and Immigrants from Grenada (3.7%, a difference of 0.46%).
| Demographics | Rating | Rank | Professional Degree |
| French American Indians | 1.7 /100 | #245 | Tragic 3.8% |
| Marshallese | 1.7 /100 | #246 | Tragic 3.8% |
| Guyanese | 1.6 /100 | #247 | Tragic 3.8% |
| Hmong | 1.6 /100 | #248 | Tragic 3.7% |
| Immigrants | Grenada | 1.5 /100 | #249 | Tragic 3.7% |
| Immigrants | Fiji | 1.5 /100 | #250 | Tragic 3.7% |
| Immigrants | Nicaragua | 1.4 /100 | #251 | Tragic 3.7% |
| Jamaicans | 1.4 /100 | #252 | Tragic 3.7% |
| Pueblo | 1.4 /100 | #253 | Tragic 3.7% |
| Tongans | 1.3 /100 | #254 | Tragic 3.7% |
| Osage | 1.2 /100 | #255 | Tragic 3.7% |
| Iroquois | 1.2 /100 | #256 | Tragic 3.7% |
| Bahamians | 1.1 /100 | #257 | Tragic 3.7% |
| Immigrants | St. Vincent and the Grenadines | 1.1 /100 | #258 | Tragic 3.7% |
| Africans | 1.0 /100 | #259 | Tragic 3.7% |
Demographics Similar to Immigrants from Eastern Africa by Professional Degree
In terms of professional degree, the demographic groups most similar to Immigrants from Eastern Africa are Serbian (4.8%, a difference of 0.020%), European (4.8%, a difference of 0.32%), Immigrants from Albania (4.8%, a difference of 0.37%), Palestinian (4.8%, a difference of 0.46%), and Icelander (4.8%, a difference of 0.48%).
| Demographics | Rating | Rank | Professional Degree |
| Immigrants | Moldova | 94.8 /100 | #121 | Exceptional 4.9% |
| Immigrants | Germany | 94.1 /100 | #122 | Exceptional 4.9% |
| Immigrants | Venezuela | 93.8 /100 | #123 | Exceptional 4.8% |
| Immigrants | Eritrea | 93.5 /100 | #124 | Exceptional 4.8% |
| Immigrants | Albania | 93.3 /100 | #125 | Exceptional 4.8% |
| Europeans | 93.2 /100 | #126 | Exceptional 4.8% |
| Serbians | 92.6 /100 | #127 | Exceptional 4.8% |
| Immigrants | Eastern Africa | 92.5 /100 | #128 | Exceptional 4.8% |
| Palestinians | 91.5 /100 | #129 | Exceptional 4.8% |
| Icelanders | 91.5 /100 | #130 | Exceptional 4.8% |
| Immigrants | Nepal | 91.4 /100 | #131 | Exceptional 4.8% |
| Pakistanis | 90.9 /100 | #132 | Exceptional 4.8% |
| Italians | 90.2 /100 | #133 | Exceptional 4.8% |
| South American Indians | 89.9 /100 | #134 | Excellent 4.8% |
| Macedonians | 89.8 /100 | #135 | Excellent 4.8% |