Jamaican vs Alaska Native Professional Degree
COMPARE
Jamaican
Alaska Native
Professional Degree
Professional Degree Comparison
Jamaicans
Alaska Natives
3.7%
PROFESSIONAL DEGREE
1.4/ 100
METRIC RATING
252nd/ 347
METRIC RANK
3.5%
PROFESSIONAL DEGREE
0.3/ 100
METRIC RATING
291st/ 347
METRIC RANK
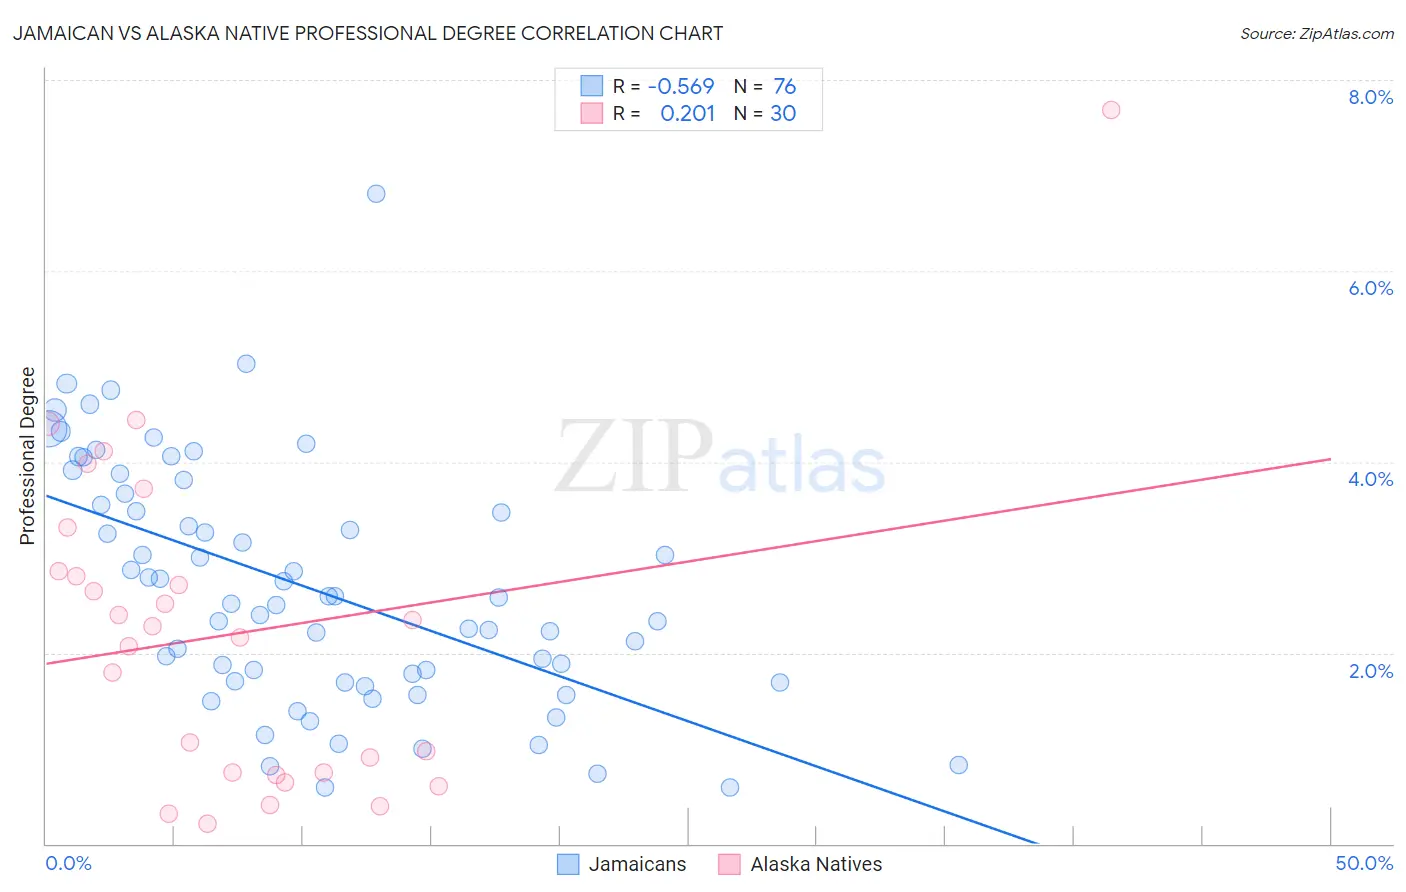
Jamaican vs Alaska Native Professional Degree Correlation Chart
The statistical analysis conducted on geographies consisting of 367,101,955 people shows a substantial negative correlation between the proportion of Jamaicans and percentage of population with at least professional degree education in the United States with a correlation coefficient (R) of -0.569 and weighted average of 3.7%. Similarly, the statistical analysis conducted on geographies consisting of 76,648,508 people shows a weak positive correlation between the proportion of Alaska Natives and percentage of population with at least professional degree education in the United States with a correlation coefficient (R) of 0.201 and weighted average of 3.5%, a difference of 7.6%.
Professional Degree Correlation Summary
| Measurement | Jamaican | Alaska Native |
| Minimum | 0.59% | 0.21% |
| Maximum | 6.8% | 7.7% |
| Range | 6.2% | 7.5% |
| Mean | 2.7% | 2.2% |
| Median | 2.5% | 2.2% |
| Interquartile 25% (IQ1) | 1.7% | 0.74% |
| Interquartile 75% (IQ3) | 3.6% | 2.9% |
| Interquartile Range (IQR) | 1.9% | 2.1% |
| Standard Deviation (Sample) | 1.3% | 1.7% |
| Standard Deviation (Population) | 1.3% | 1.7% |
Similar Demographics by Professional Degree
Demographics Similar to Jamaicans by Professional Degree
In terms of professional degree, the demographic groups most similar to Jamaicans are Pueblo (3.7%, a difference of 0.10%), Immigrants from Nicaragua (3.7%, a difference of 0.14%), Tongan (3.7%, a difference of 0.24%), Immigrants from Fiji (3.7%, a difference of 0.39%), and Immigrants from Grenada (3.7%, a difference of 0.46%).
| Demographics | Rating | Rank | Professional Degree |
| French American Indians | 1.7 /100 | #245 | Tragic 3.8% |
| Marshallese | 1.7 /100 | #246 | Tragic 3.8% |
| Guyanese | 1.6 /100 | #247 | Tragic 3.8% |
| Hmong | 1.6 /100 | #248 | Tragic 3.7% |
| Immigrants | Grenada | 1.5 /100 | #249 | Tragic 3.7% |
| Immigrants | Fiji | 1.5 /100 | #250 | Tragic 3.7% |
| Immigrants | Nicaragua | 1.4 /100 | #251 | Tragic 3.7% |
| Jamaicans | 1.4 /100 | #252 | Tragic 3.7% |
| Pueblo | 1.4 /100 | #253 | Tragic 3.7% |
| Tongans | 1.3 /100 | #254 | Tragic 3.7% |
| Osage | 1.2 /100 | #255 | Tragic 3.7% |
| Iroquois | 1.2 /100 | #256 | Tragic 3.7% |
| Bahamians | 1.1 /100 | #257 | Tragic 3.7% |
| Immigrants | St. Vincent and the Grenadines | 1.1 /100 | #258 | Tragic 3.7% |
| Africans | 1.0 /100 | #259 | Tragic 3.7% |
Demographics Similar to Alaska Natives by Professional Degree
In terms of professional degree, the demographic groups most similar to Alaska Natives are Immigrants from Belize (3.5%, a difference of 0.070%), Chippewa (3.5%, a difference of 0.17%), Guatemalan (3.5%, a difference of 0.18%), Immigrants from Honduras (3.5%, a difference of 0.30%), and Blackfeet (3.5%, a difference of 0.36%).
| Demographics | Rating | Rank | Professional Degree |
| Salvadorans | 0.4 /100 | #284 | Tragic 3.5% |
| Hondurans | 0.3 /100 | #285 | Tragic 3.5% |
| Haitians | 0.3 /100 | #286 | Tragic 3.5% |
| Immigrants | El Salvador | 0.3 /100 | #287 | Tragic 3.5% |
| Blackfeet | 0.3 /100 | #288 | Tragic 3.5% |
| Guatemalans | 0.3 /100 | #289 | Tragic 3.5% |
| Chippewa | 0.3 /100 | #290 | Tragic 3.5% |
| Alaska Natives | 0.3 /100 | #291 | Tragic 3.5% |
| Immigrants | Belize | 0.3 /100 | #292 | Tragic 3.5% |
| Immigrants | Honduras | 0.3 /100 | #293 | Tragic 3.5% |
| Paiute | 0.3 /100 | #294 | Tragic 3.4% |
| Immigrants | Guatemala | 0.2 /100 | #295 | Tragic 3.4% |
| Hawaiians | 0.2 /100 | #296 | Tragic 3.4% |
| Immigrants | Liberia | 0.2 /100 | #297 | Tragic 3.4% |
| Ottawa | 0.2 /100 | #298 | Tragic 3.4% |