Scottish vs Immigrants from Lithuania Professional Degree
COMPARE
Scottish
Immigrants from Lithuania
Professional Degree
Professional Degree Comparison
Scottish
Immigrants from Lithuania
4.6%
PROFESSIONAL DEGREE
71.8/ 100
METRIC RATING
154th/ 347
METRIC RANK
5.6%
PROFESSIONAL DEGREE
99.9/ 100
METRIC RATING
61st/ 347
METRIC RANK
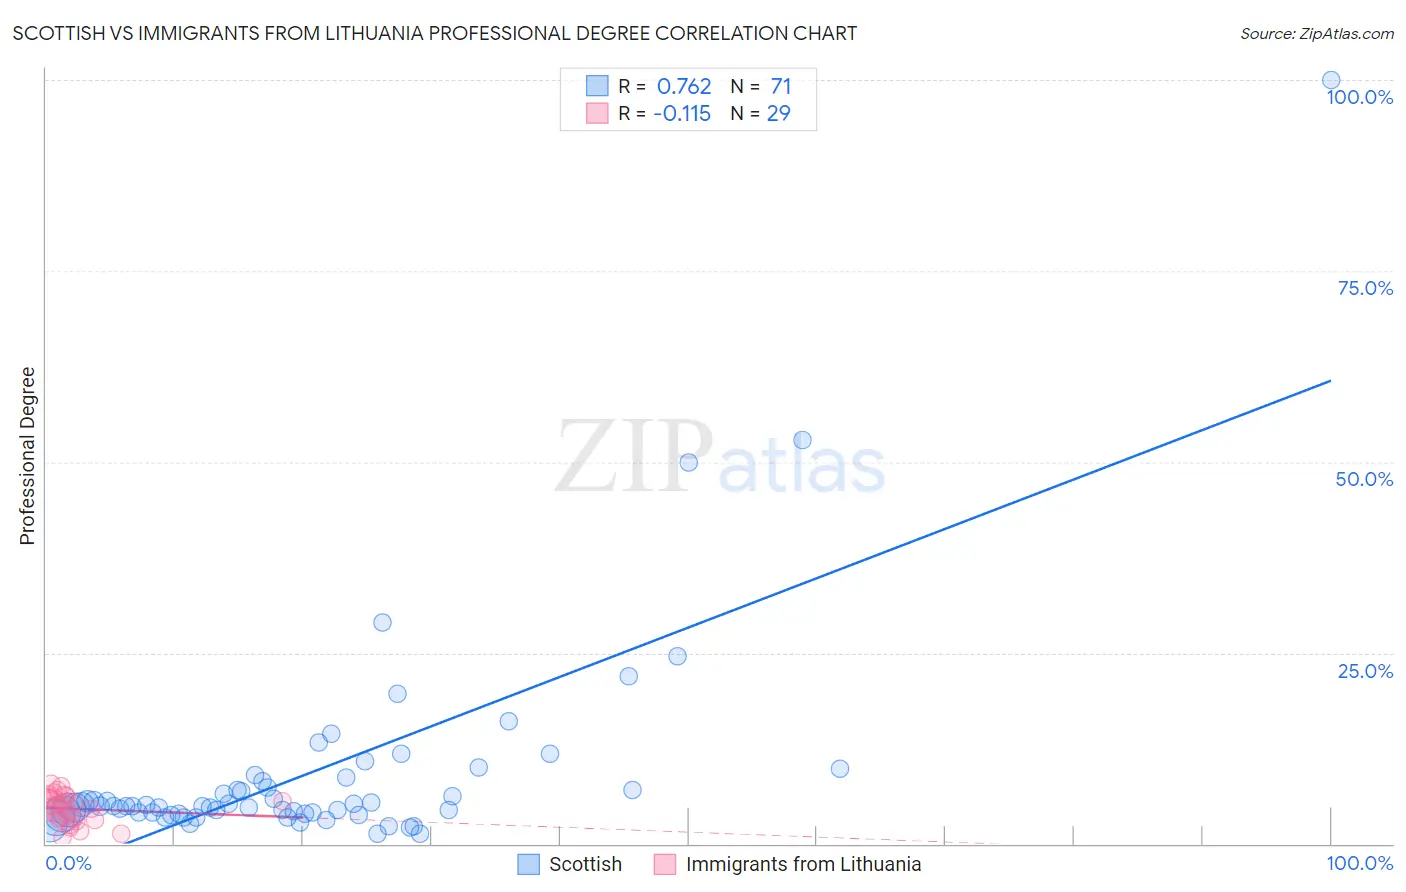
Scottish vs Immigrants from Lithuania Professional Degree Correlation Chart
The statistical analysis conducted on geographies consisting of 558,904,242 people shows a strong positive correlation between the proportion of Scottish and percentage of population with at least professional degree education in the United States with a correlation coefficient (R) of 0.762 and weighted average of 4.6%. Similarly, the statistical analysis conducted on geographies consisting of 117,699,727 people shows a poor negative correlation between the proportion of Immigrants from Lithuania and percentage of population with at least professional degree education in the United States with a correlation coefficient (R) of -0.115 and weighted average of 5.6%, a difference of 22.4%.
Professional Degree Correlation Summary
| Measurement | Scottish | Immigrants from Lithuania |
| Minimum | 1.3% | 0.77% |
| Maximum | 100.0% | 7.9% |
| Range | 98.7% | 7.1% |
| Mean | 9.2% | 4.6% |
| Median | 4.9% | 4.9% |
| Interquartile 25% (IQ1) | 4.0% | 3.2% |
| Interquartile 75% (IQ3) | 8.2% | 6.0% |
| Interquartile Range (IQR) | 4.2% | 2.8% |
| Standard Deviation (Sample) | 14.2% | 1.9% |
| Standard Deviation (Population) | 14.1% | 1.9% |
Similar Demographics by Professional Degree
Demographics Similar to Scottish by Professional Degree
In terms of professional degree, the demographic groups most similar to Scottish are Immigrants from Africa (4.6%, a difference of 0.12%), Immigrants from Uruguay (4.6%, a difference of 0.12%), Polish (4.6%, a difference of 0.14%), Slavic (4.5%, a difference of 0.18%), and Immigrants from Oceania (4.6%, a difference of 0.28%).
| Demographics | Rating | Rank | Professional Degree |
| Colombians | 77.7 /100 | #147 | Good 4.6% |
| Slovenes | 76.1 /100 | #148 | Good 4.6% |
| Senegalese | 75.3 /100 | #149 | Good 4.6% |
| Immigrants | Oceania | 73.4 /100 | #150 | Good 4.6% |
| Poles | 72.6 /100 | #151 | Good 4.6% |
| Immigrants | Africa | 72.5 /100 | #152 | Good 4.6% |
| Immigrants | Uruguay | 72.5 /100 | #153 | Good 4.6% |
| Scottish | 71.8 /100 | #154 | Good 4.6% |
| Slavs | 70.8 /100 | #155 | Good 4.5% |
| Swedes | 69.9 /100 | #156 | Good 4.5% |
| Iraqis | 69.8 /100 | #157 | Good 4.5% |
| Immigrants | Armenia | 68.8 /100 | #158 | Good 4.5% |
| Vietnamese | 68.4 /100 | #159 | Good 4.5% |
| Immigrants | Senegal | 68.0 /100 | #160 | Good 4.5% |
| Assyrians/Chaldeans/Syriacs | 67.4 /100 | #161 | Good 4.5% |
Demographics Similar to Immigrants from Lithuania by Professional Degree
In terms of professional degree, the demographic groups most similar to Immigrants from Lithuania are Bolivian (5.6%, a difference of 0.65%), Immigrants from Belarus (5.5%, a difference of 0.76%), Immigrants from Europe (5.6%, a difference of 1.1%), Asian (5.5%, a difference of 1.2%), and Immigrants from Asia (5.5%, a difference of 1.3%).
| Demographics | Rating | Rank | Professional Degree |
| Immigrants | Kuwait | 100.0 /100 | #54 | Exceptional 5.7% |
| Immigrants | Western Europe | 100.0 /100 | #55 | Exceptional 5.7% |
| Immigrants | Malaysia | 100.0 /100 | #56 | Exceptional 5.7% |
| South Africans | 100.0 /100 | #57 | Exceptional 5.7% |
| Bulgarians | 100.0 /100 | #58 | Exceptional 5.7% |
| Immigrants | Europe | 100.0 /100 | #59 | Exceptional 5.6% |
| Bolivians | 99.9 /100 | #60 | Exceptional 5.6% |
| Immigrants | Lithuania | 99.9 /100 | #61 | Exceptional 5.6% |
| Immigrants | Belarus | 99.9 /100 | #62 | Exceptional 5.5% |
| Asians | 99.9 /100 | #63 | Exceptional 5.5% |
| Immigrants | Asia | 99.9 /100 | #64 | Exceptional 5.5% |
| Immigrants | Bolivia | 99.9 /100 | #65 | Exceptional 5.5% |
| Immigrants | Kazakhstan | 99.9 /100 | #66 | Exceptional 5.5% |
| Immigrants | Bulgaria | 99.9 /100 | #67 | Exceptional 5.5% |
| Immigrants | Lebanon | 99.9 /100 | #68 | Exceptional 5.5% |