Spanish American Indian vs Slovak Bachelor's Degree
COMPARE
Spanish American Indian
Slovak
Bachelor's Degree
Bachelor's Degree Comparison
Spanish American Indians
Slovaks
27.5%
BACHELOR'S DEGREE
0.0/ 100
METRIC RATING
330th/ 347
METRIC RANK
37.3%
BACHELOR'S DEGREE
36.9/ 100
METRIC RATING
189th/ 347
METRIC RANK
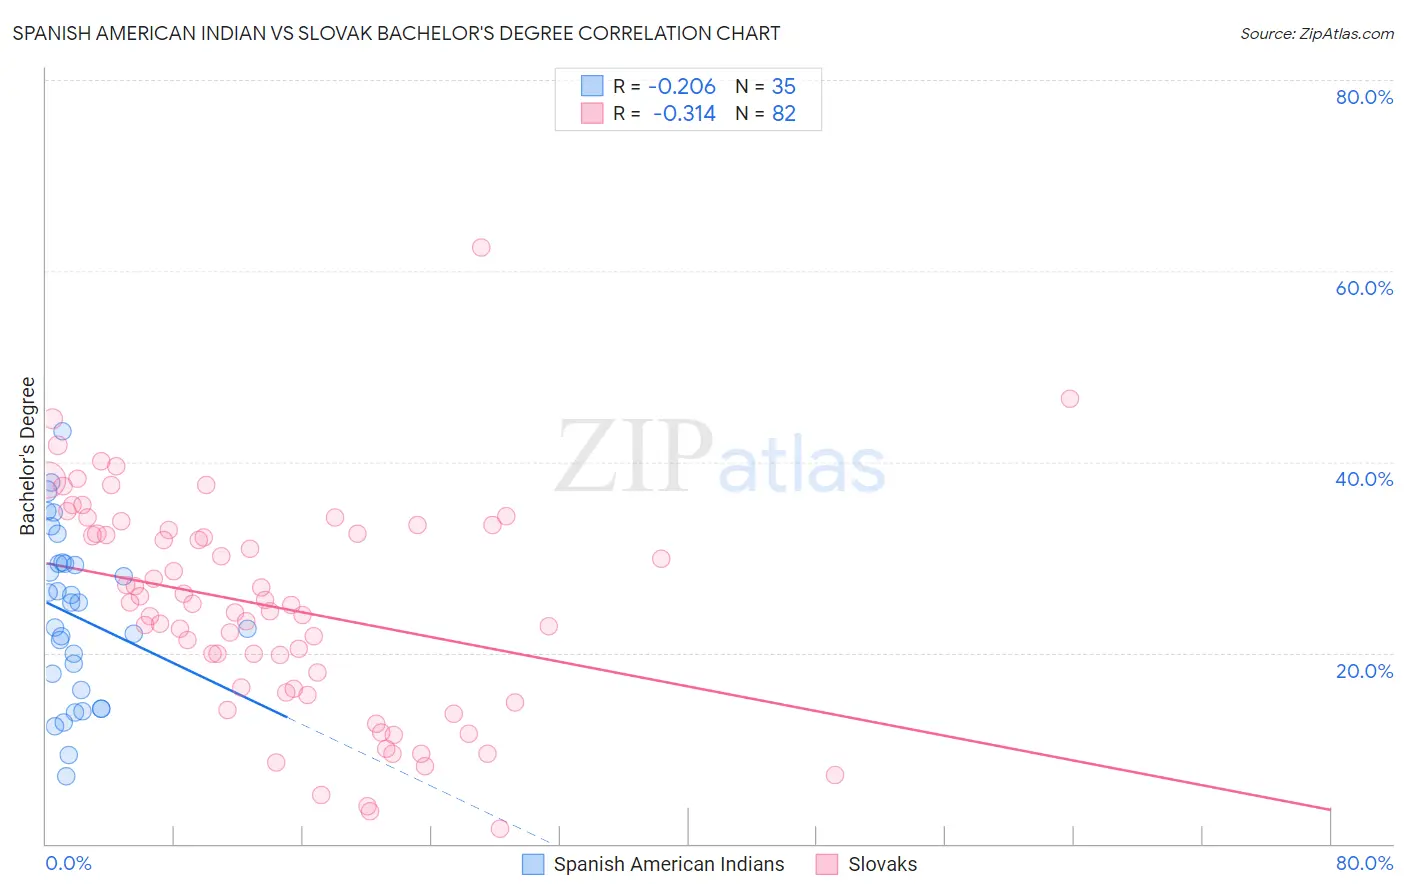
Spanish American Indian vs Slovak Bachelor's Degree Correlation Chart
The statistical analysis conducted on geographies consisting of 73,150,359 people shows a weak negative correlation between the proportion of Spanish American Indians and percentage of population with at least bachelor's degree education in the United States with a correlation coefficient (R) of -0.206 and weighted average of 27.5%. Similarly, the statistical analysis conducted on geographies consisting of 397,863,684 people shows a mild negative correlation between the proportion of Slovaks and percentage of population with at least bachelor's degree education in the United States with a correlation coefficient (R) of -0.314 and weighted average of 37.3%, a difference of 36.0%.
Bachelor's Degree Correlation Summary
| Measurement | Spanish American Indian | Slovak |
| Minimum | 7.0% | 1.5% |
| Maximum | 43.2% | 62.5% |
| Range | 36.2% | 61.0% |
| Mean | 23.9% | 24.8% |
| Median | 25.2% | 25.1% |
| Interquartile 25% (IQ1) | 16.1% | 16.2% |
| Interquartile 75% (IQ3) | 29.3% | 32.9% |
| Interquartile Range (IQR) | 13.3% | 16.7% |
| Standard Deviation (Sample) | 8.8% | 11.3% |
| Standard Deviation (Population) | 8.7% | 11.3% |
Similar Demographics by Bachelor's Degree
Demographics Similar to Spanish American Indians by Bachelor's Degree
In terms of bachelor's degree, the demographic groups most similar to Spanish American Indians are Immigrants from Central America (27.5%, a difference of 0.060%), Immigrants from the Azores (27.3%, a difference of 0.48%), Menominee (27.3%, a difference of 0.58%), Crow (27.7%, a difference of 1.1%), and Mexican (27.1%, a difference of 1.4%).
| Demographics | Rating | Rank | Bachelor's Degree |
| Fijians | 0.0 /100 | #323 | Tragic 28.7% |
| Dutch West Indians | 0.0 /100 | #324 | Tragic 28.5% |
| Pennsylvania Germans | 0.0 /100 | #325 | Tragic 28.4% |
| Apache | 0.0 /100 | #326 | Tragic 28.3% |
| Paiute | 0.0 /100 | #327 | Tragic 28.1% |
| Crow | 0.0 /100 | #328 | Tragic 27.7% |
| Immigrants | Central America | 0.0 /100 | #329 | Tragic 27.5% |
| Spanish American Indians | 0.0 /100 | #330 | Tragic 27.5% |
| Immigrants | Azores | 0.0 /100 | #331 | Tragic 27.3% |
| Menominee | 0.0 /100 | #332 | Tragic 27.3% |
| Mexicans | 0.0 /100 | #333 | Tragic 27.1% |
| Arapaho | 0.0 /100 | #334 | Tragic 26.6% |
| Natives/Alaskans | 0.0 /100 | #335 | Tragic 26.3% |
| Immigrants | Mexico | 0.0 /100 | #336 | Tragic 26.1% |
| Inupiat | 0.0 /100 | #337 | Tragic 25.8% |
Demographics Similar to Slovaks by Bachelor's Degree
In terms of bachelor's degree, the demographic groups most similar to Slovaks are Immigrants from Oceania (37.3%, a difference of 0.050%), English (37.4%, a difference of 0.29%), Swiss (37.2%, a difference of 0.30%), Nigerian (37.2%, a difference of 0.32%), and Norwegian (37.5%, a difference of 0.36%).
| Demographics | Rating | Rank | Bachelor's Degree |
| Immigrants | Bosnia and Herzegovina | 43.4 /100 | #182 | Average 37.6% |
| Senegalese | 42.2 /100 | #183 | Average 37.5% |
| Scandinavians | 41.7 /100 | #184 | Average 37.5% |
| Immigrants | Peru | 41.3 /100 | #185 | Average 37.5% |
| Norwegians | 40.4 /100 | #186 | Average 37.5% |
| English | 39.7 /100 | #187 | Fair 37.4% |
| Immigrants | Oceania | 37.3 /100 | #188 | Fair 37.3% |
| Slovaks | 36.9 /100 | #189 | Fair 37.3% |
| Swiss | 34.1 /100 | #190 | Fair 37.2% |
| Nigerians | 33.9 /100 | #191 | Fair 37.2% |
| Immigrants | Vietnam | 32.1 /100 | #192 | Fair 37.1% |
| Yugoslavians | 31.5 /100 | #193 | Fair 37.1% |
| Belgians | 29.9 /100 | #194 | Fair 37.0% |
| Koreans | 29.8 /100 | #195 | Fair 37.0% |
| Celtics | 29.5 /100 | #196 | Fair 37.0% |