South African vs Slovak Bachelor's Degree
COMPARE
South African
Slovak
Bachelor's Degree
Bachelor's Degree Comparison
South Africans
Slovaks
43.6%
BACHELOR'S DEGREE
99.8/ 100
METRIC RATING
61st/ 347
METRIC RANK
37.3%
BACHELOR'S DEGREE
36.9/ 100
METRIC RATING
189th/ 347
METRIC RANK
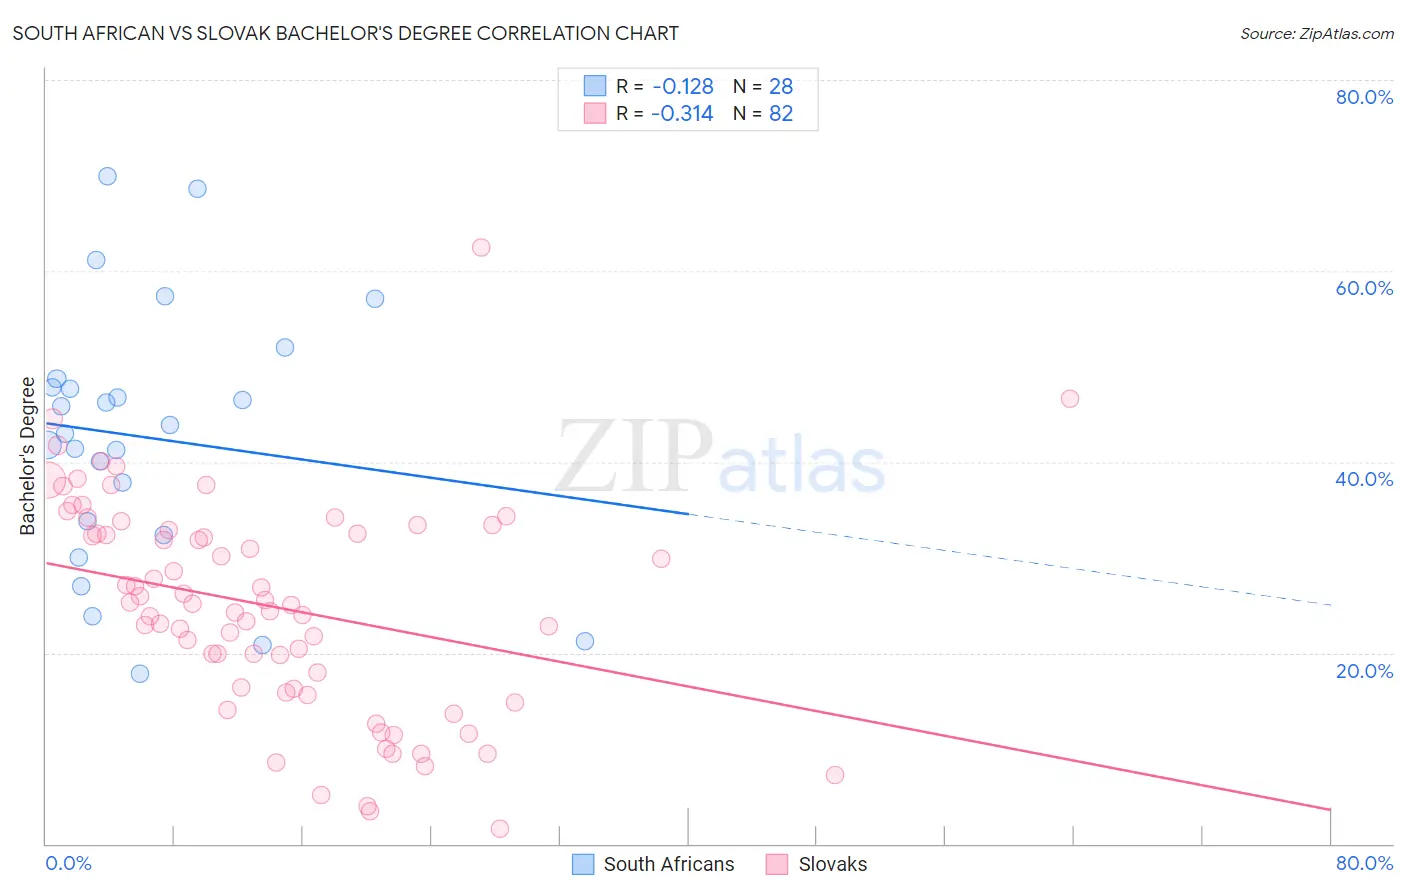
South African vs Slovak Bachelor's Degree Correlation Chart
The statistical analysis conducted on geographies consisting of 182,590,093 people shows a poor negative correlation between the proportion of South Africans and percentage of population with at least bachelor's degree education in the United States with a correlation coefficient (R) of -0.128 and weighted average of 43.6%. Similarly, the statistical analysis conducted on geographies consisting of 397,863,684 people shows a mild negative correlation between the proportion of Slovaks and percentage of population with at least bachelor's degree education in the United States with a correlation coefficient (R) of -0.314 and weighted average of 37.3%, a difference of 16.7%.
Bachelor's Degree Correlation Summary
| Measurement | South African | Slovak |
| Minimum | 17.8% | 1.5% |
| Maximum | 69.9% | 62.5% |
| Range | 52.1% | 61.0% |
| Mean | 42.6% | 24.8% |
| Median | 43.4% | 25.1% |
| Interquartile 25% (IQ1) | 33.1% | 16.2% |
| Interquartile 75% (IQ3) | 48.3% | 32.9% |
| Interquartile Range (IQR) | 15.2% | 16.7% |
| Standard Deviation (Sample) | 13.5% | 11.3% |
| Standard Deviation (Population) | 13.3% | 11.3% |
Similar Demographics by Bachelor's Degree
Demographics Similar to South Africans by Bachelor's Degree
In terms of bachelor's degree, the demographic groups most similar to South Africans are Immigrants from Kazakhstan (43.4%, a difference of 0.30%), Immigrants from Europe (43.4%, a difference of 0.34%), Argentinean (43.3%, a difference of 0.62%), Zimbabwean (43.3%, a difference of 0.62%), and Immigrants from Netherlands (43.3%, a difference of 0.64%).
| Demographics | Rating | Rank | Bachelor's Degree |
| Immigrants | Austria | 99.9 /100 | #54 | Exceptional 44.2% |
| Immigrants | Bolivia | 99.9 /100 | #55 | Exceptional 44.2% |
| Immigrants | Serbia | 99.9 /100 | #56 | Exceptional 44.1% |
| Paraguayans | 99.9 /100 | #57 | Exceptional 44.0% |
| Immigrants | Czechoslovakia | 99.9 /100 | #58 | Exceptional 44.0% |
| Australians | 99.9 /100 | #59 | Exceptional 44.0% |
| New Zealanders | 99.9 /100 | #60 | Exceptional 44.0% |
| South Africans | 99.8 /100 | #61 | Exceptional 43.6% |
| Immigrants | Kazakhstan | 99.8 /100 | #62 | Exceptional 43.4% |
| Immigrants | Europe | 99.8 /100 | #63 | Exceptional 43.4% |
| Argentineans | 99.7 /100 | #64 | Exceptional 43.3% |
| Zimbabweans | 99.7 /100 | #65 | Exceptional 43.3% |
| Immigrants | Netherlands | 99.7 /100 | #66 | Exceptional 43.3% |
| Egyptians | 99.7 /100 | #67 | Exceptional 43.3% |
| Immigrants | Indonesia | 99.7 /100 | #68 | Exceptional 43.3% |
Demographics Similar to Slovaks by Bachelor's Degree
In terms of bachelor's degree, the demographic groups most similar to Slovaks are Immigrants from Oceania (37.3%, a difference of 0.050%), English (37.4%, a difference of 0.29%), Swiss (37.2%, a difference of 0.30%), Nigerian (37.2%, a difference of 0.32%), and Norwegian (37.5%, a difference of 0.36%).
| Demographics | Rating | Rank | Bachelor's Degree |
| Immigrants | Bosnia and Herzegovina | 43.4 /100 | #182 | Average 37.6% |
| Senegalese | 42.2 /100 | #183 | Average 37.5% |
| Scandinavians | 41.7 /100 | #184 | Average 37.5% |
| Immigrants | Peru | 41.3 /100 | #185 | Average 37.5% |
| Norwegians | 40.4 /100 | #186 | Average 37.5% |
| English | 39.7 /100 | #187 | Fair 37.4% |
| Immigrants | Oceania | 37.3 /100 | #188 | Fair 37.3% |
| Slovaks | 36.9 /100 | #189 | Fair 37.3% |
| Swiss | 34.1 /100 | #190 | Fair 37.2% |
| Nigerians | 33.9 /100 | #191 | Fair 37.2% |
| Immigrants | Vietnam | 32.1 /100 | #192 | Fair 37.1% |
| Yugoslavians | 31.5 /100 | #193 | Fair 37.1% |
| Belgians | 29.9 /100 | #194 | Fair 37.0% |
| Koreans | 29.8 /100 | #195 | Fair 37.0% |
| Celtics | 29.5 /100 | #196 | Fair 37.0% |