Nigerian vs Immigrants from Nepal Bachelor's Degree
COMPARE
Nigerian
Immigrants from Nepal
Bachelor's Degree
Bachelor's Degree Comparison
Nigerians
Immigrants from Nepal
37.2%
BACHELOR'S DEGREE
33.9/ 100
METRIC RATING
191st/ 347
METRIC RANK
41.7%
BACHELOR'S DEGREE
98.6/ 100
METRIC RATING
94th/ 347
METRIC RANK
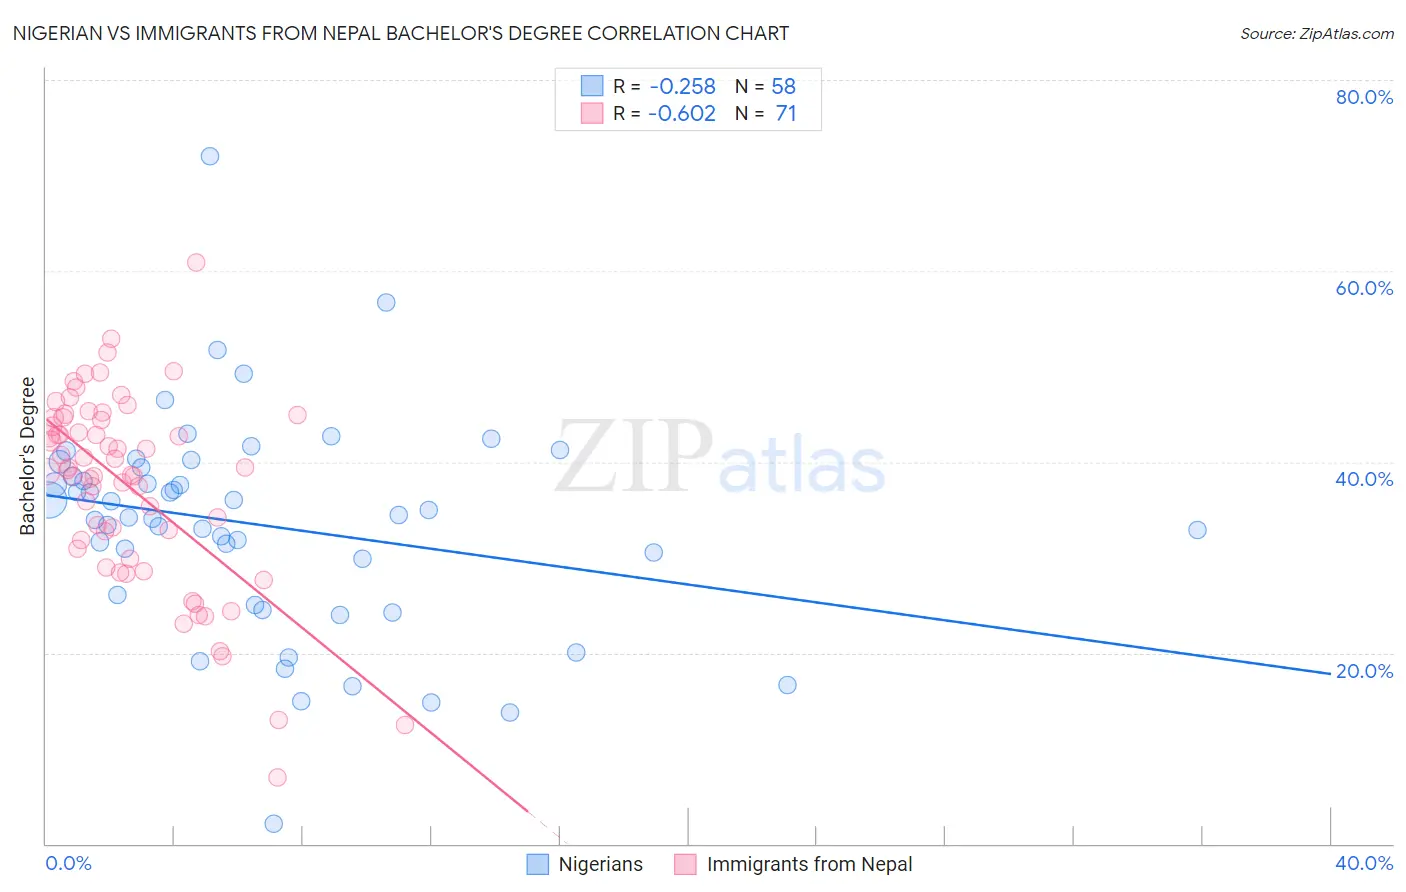
Nigerian vs Immigrants from Nepal Bachelor's Degree Correlation Chart
The statistical analysis conducted on geographies consisting of 332,744,449 people shows a weak negative correlation between the proportion of Nigerians and percentage of population with at least bachelor's degree education in the United States with a correlation coefficient (R) of -0.258 and weighted average of 37.2%. Similarly, the statistical analysis conducted on geographies consisting of 186,767,896 people shows a significant negative correlation between the proportion of Immigrants from Nepal and percentage of population with at least bachelor's degree education in the United States with a correlation coefficient (R) of -0.602 and weighted average of 41.7%, a difference of 12.1%.
Bachelor's Degree Correlation Summary
| Measurement | Nigerian | Immigrants from Nepal |
| Minimum | 2.0% | 7.0% |
| Maximum | 72.0% | 60.9% |
| Range | 70.0% | 53.9% |
| Mean | 33.4% | 37.3% |
| Median | 34.3% | 39.2% |
| Interquartile 25% (IQ1) | 26.1% | 30.9% |
| Interquartile 75% (IQ3) | 39.4% | 44.6% |
| Interquartile Range (IQR) | 13.3% | 13.7% |
| Standard Deviation (Sample) | 11.4% | 10.1% |
| Standard Deviation (Population) | 11.3% | 10.0% |
Similar Demographics by Bachelor's Degree
Demographics Similar to Nigerians by Bachelor's Degree
In terms of bachelor's degree, the demographic groups most similar to Nigerians are Swiss (37.2%, a difference of 0.020%), Immigrants from Vietnam (37.1%, a difference of 0.20%), Yugoslavian (37.1%, a difference of 0.27%), Slovak (37.3%, a difference of 0.32%), and Immigrants from Oceania (37.3%, a difference of 0.37%).
| Demographics | Rating | Rank | Bachelor's Degree |
| Scandinavians | 41.7 /100 | #184 | Average 37.5% |
| Immigrants | Peru | 41.3 /100 | #185 | Average 37.5% |
| Norwegians | 40.4 /100 | #186 | Average 37.5% |
| English | 39.7 /100 | #187 | Fair 37.4% |
| Immigrants | Oceania | 37.3 /100 | #188 | Fair 37.3% |
| Slovaks | 36.9 /100 | #189 | Fair 37.3% |
| Swiss | 34.1 /100 | #190 | Fair 37.2% |
| Nigerians | 33.9 /100 | #191 | Fair 37.2% |
| Immigrants | Vietnam | 32.1 /100 | #192 | Fair 37.1% |
| Yugoslavians | 31.5 /100 | #193 | Fair 37.1% |
| Belgians | 29.9 /100 | #194 | Fair 37.0% |
| Koreans | 29.8 /100 | #195 | Fair 37.0% |
| Celtics | 29.5 /100 | #196 | Fair 37.0% |
| Czechoslovakians | 29.2 /100 | #197 | Fair 37.0% |
| Welsh | 29.1 /100 | #198 | Fair 37.0% |
Demographics Similar to Immigrants from Nepal by Bachelor's Degree
In terms of bachelor's degree, the demographic groups most similar to Immigrants from Nepal are Immigrants from Canada (41.7%, a difference of 0.020%), Immigrants from North America (41.7%, a difference of 0.12%), Immigrants from Moldova (41.6%, a difference of 0.23%), Romanian (41.6%, a difference of 0.29%), and Immigrants from Ukraine (41.5%, a difference of 0.40%).
| Demographics | Rating | Rank | Bachelor's Degree |
| Carpatho Rusyns | 99.0 /100 | #87 | Exceptional 42.1% |
| Immigrants | Western Europe | 99.0 /100 | #88 | Exceptional 42.0% |
| Greeks | 99.0 /100 | #89 | Exceptional 42.0% |
| Laotians | 98.9 /100 | #90 | Exceptional 42.0% |
| Immigrants | Northern Africa | 98.9 /100 | #91 | Exceptional 41.9% |
| Maltese | 98.8 /100 | #92 | Exceptional 41.9% |
| Immigrants | Canada | 98.6 /100 | #93 | Exceptional 41.7% |
| Immigrants | Nepal | 98.6 /100 | #94 | Exceptional 41.7% |
| Immigrants | North America | 98.5 /100 | #95 | Exceptional 41.7% |
| Immigrants | Moldova | 98.4 /100 | #96 | Exceptional 41.6% |
| Romanians | 98.4 /100 | #97 | Exceptional 41.6% |
| Immigrants | Ukraine | 98.3 /100 | #98 | Exceptional 41.5% |
| Immigrants | England | 98.1 /100 | #99 | Exceptional 41.4% |
| Macedonians | 98.1 /100 | #100 | Exceptional 41.4% |
| Immigrants | Morocco | 98.0 /100 | #101 | Exceptional 41.4% |