Iranian vs Immigrants from Nepal 2nd Grade
COMPARE
Iranian
Immigrants from Nepal
2nd Grade
2nd Grade Comparison
Iranians
Immigrants from Nepal
98.1%
2ND GRADE
95.9/ 100
METRIC RATING
115th/ 347
METRIC RANK
97.6%
2ND GRADE
4.0/ 100
METRIC RATING
227th/ 347
METRIC RANK
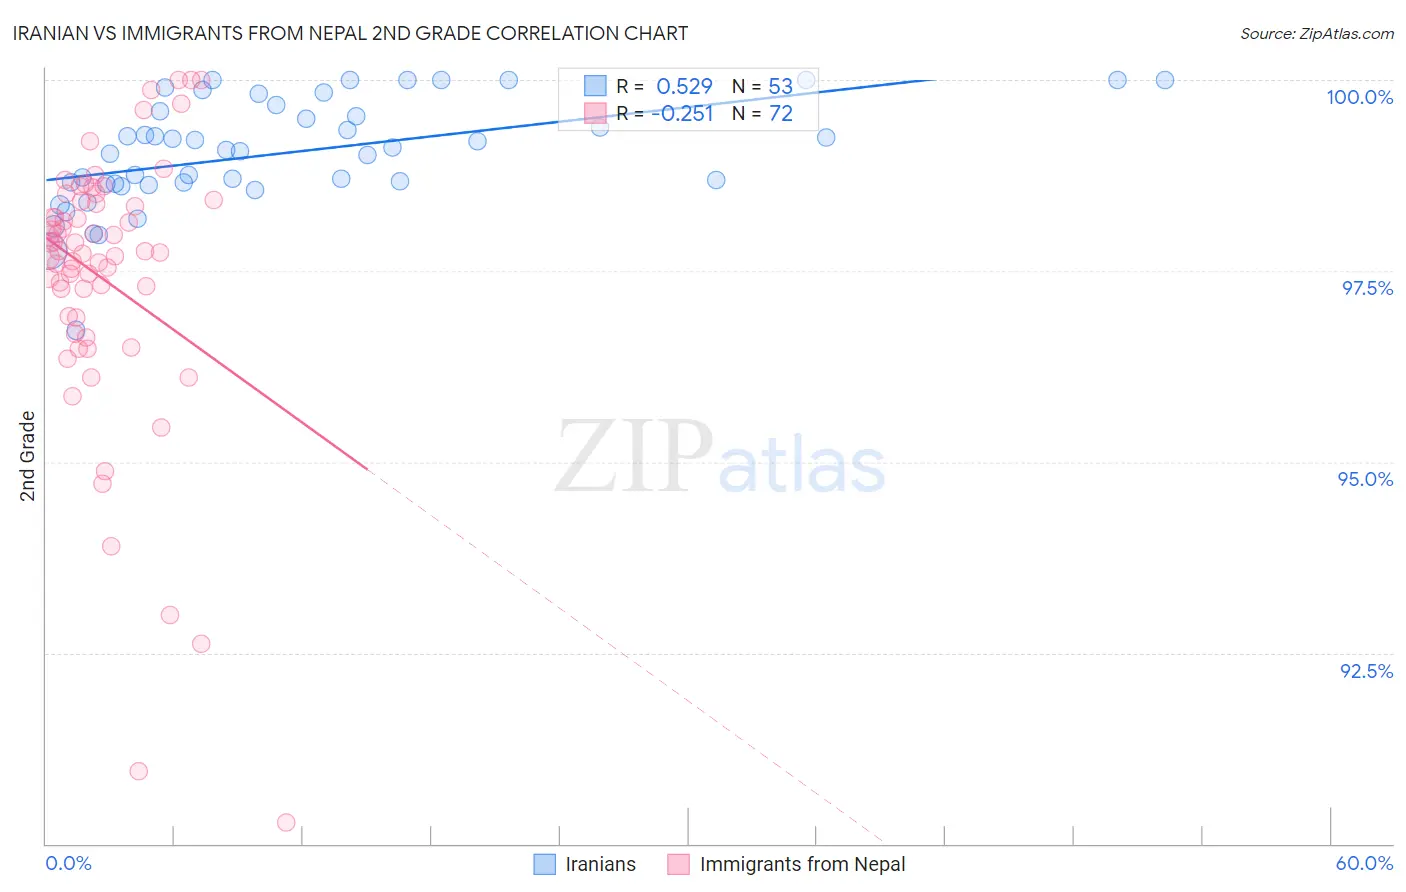
Iranian vs Immigrants from Nepal 2nd Grade Correlation Chart
The statistical analysis conducted on geographies consisting of 316,902,340 people shows a substantial positive correlation between the proportion of Iranians and percentage of population with at least 2nd grade education in the United States with a correlation coefficient (R) of 0.529 and weighted average of 98.1%. Similarly, the statistical analysis conducted on geographies consisting of 186,766,254 people shows a weak negative correlation between the proportion of Immigrants from Nepal and percentage of population with at least 2nd grade education in the United States with a correlation coefficient (R) of -0.251 and weighted average of 97.6%, a difference of 0.50%.
2nd Grade Correlation Summary
| Measurement | Iranian | Immigrants from Nepal |
| Minimum | 96.7% | 90.3% |
| Maximum | 100.0% | 100.0% |
| Range | 3.3% | 9.7% |
| Mean | 99.0% | 97.4% |
| Median | 99.1% | 97.7% |
| Interquartile 25% (IQ1) | 98.6% | 96.9% |
| Interquartile 75% (IQ3) | 99.6% | 98.4% |
| Interquartile Range (IQR) | 0.99% | 1.5% |
| Standard Deviation (Sample) | 0.71% | 1.8% |
| Standard Deviation (Population) | 0.70% | 1.8% |
Similar Demographics by 2nd Grade
Demographics Similar to Iranians by 2nd Grade
In terms of 2nd grade, the demographic groups most similar to Iranians are Spanish (98.1%, a difference of 0.0%), Immigrants from Norway (98.1%, a difference of 0.010%), Immigrants from Latvia (98.1%, a difference of 0.010%), Ute (98.1%, a difference of 0.010%), and Immigrants from France (98.1%, a difference of 0.010%).
| Demographics | Rating | Rank | 2nd Grade |
| Immigrants | Switzerland | 97.3 /100 | #108 | Exceptional 98.1% |
| Basques | 97.2 /100 | #109 | Exceptional 98.1% |
| Immigrants | Singapore | 97.0 /100 | #110 | Exceptional 98.1% |
| Immigrants | Czechoslovakia | 96.9 /100 | #111 | Exceptional 98.1% |
| Colville | 96.6 /100 | #112 | Exceptional 98.1% |
| Immigrants | Norway | 96.5 /100 | #113 | Exceptional 98.1% |
| Immigrants | Latvia | 96.4 /100 | #114 | Exceptional 98.1% |
| Iranians | 95.9 /100 | #115 | Exceptional 98.1% |
| Spanish | 95.8 /100 | #116 | Exceptional 98.1% |
| Ute | 95.7 /100 | #117 | Exceptional 98.1% |
| Immigrants | France | 95.6 /100 | #118 | Exceptional 98.1% |
| Thais | 95.3 /100 | #119 | Exceptional 98.1% |
| Okinawans | 94.9 /100 | #120 | Exceptional 98.1% |
| Immigrants | Zimbabwe | 94.4 /100 | #121 | Exceptional 98.1% |
| Lebanese | 94.2 /100 | #122 | Exceptional 98.1% |
Demographics Similar to Immigrants from Nepal by 2nd Grade
In terms of 2nd grade, the demographic groups most similar to Immigrants from Nepal are Immigrants from Syria (97.6%, a difference of 0.0%), Iraqi (97.6%, a difference of 0.010%), Immigrants from Sudan (97.6%, a difference of 0.010%), Sierra Leonean (97.6%, a difference of 0.010%), and Immigrants from Zaire (97.6%, a difference of 0.010%).
| Demographics | Rating | Rank | 2nd Grade |
| Immigrants | Morocco | 5.0 /100 | #220 | Tragic 97.6% |
| Iraqis | 4.6 /100 | #221 | Tragic 97.6% |
| Immigrants | Sudan | 4.5 /100 | #222 | Tragic 97.6% |
| Sierra Leoneans | 4.3 /100 | #223 | Tragic 97.6% |
| Immigrants | Zaire | 4.3 /100 | #224 | Tragic 97.6% |
| Tongans | 4.3 /100 | #225 | Tragic 97.6% |
| Immigrants | Syria | 4.0 /100 | #226 | Tragic 97.6% |
| Immigrants | Nepal | 4.0 /100 | #227 | Tragic 97.6% |
| Sub-Saharan Africans | 3.4 /100 | #228 | Tragic 97.6% |
| Immigrants | Costa Rica | 3.1 /100 | #229 | Tragic 97.6% |
| Senegalese | 3.1 /100 | #230 | Tragic 97.6% |
| Immigrants | Pakistan | 2.3 /100 | #231 | Tragic 97.6% |
| Immigrants | Western Asia | 2.1 /100 | #232 | Tragic 97.6% |
| Immigrants | Uruguay | 2.1 /100 | #233 | Tragic 97.6% |
| Immigrants | Malaysia | 2.0 /100 | #234 | Tragic 97.6% |