Iranian vs Immigrants from Micronesia 10th Grade
COMPARE
Iranian
Immigrants from Micronesia
10th Grade
10th Grade Comparison
Iranians
Immigrants from Micronesia
95.3%
10TH GRADE
100.0/ 100
METRIC RATING
31st/ 347
METRIC RANK
93.5%
10TH GRADE
23.2/ 100
METRIC RATING
198th/ 347
METRIC RANK
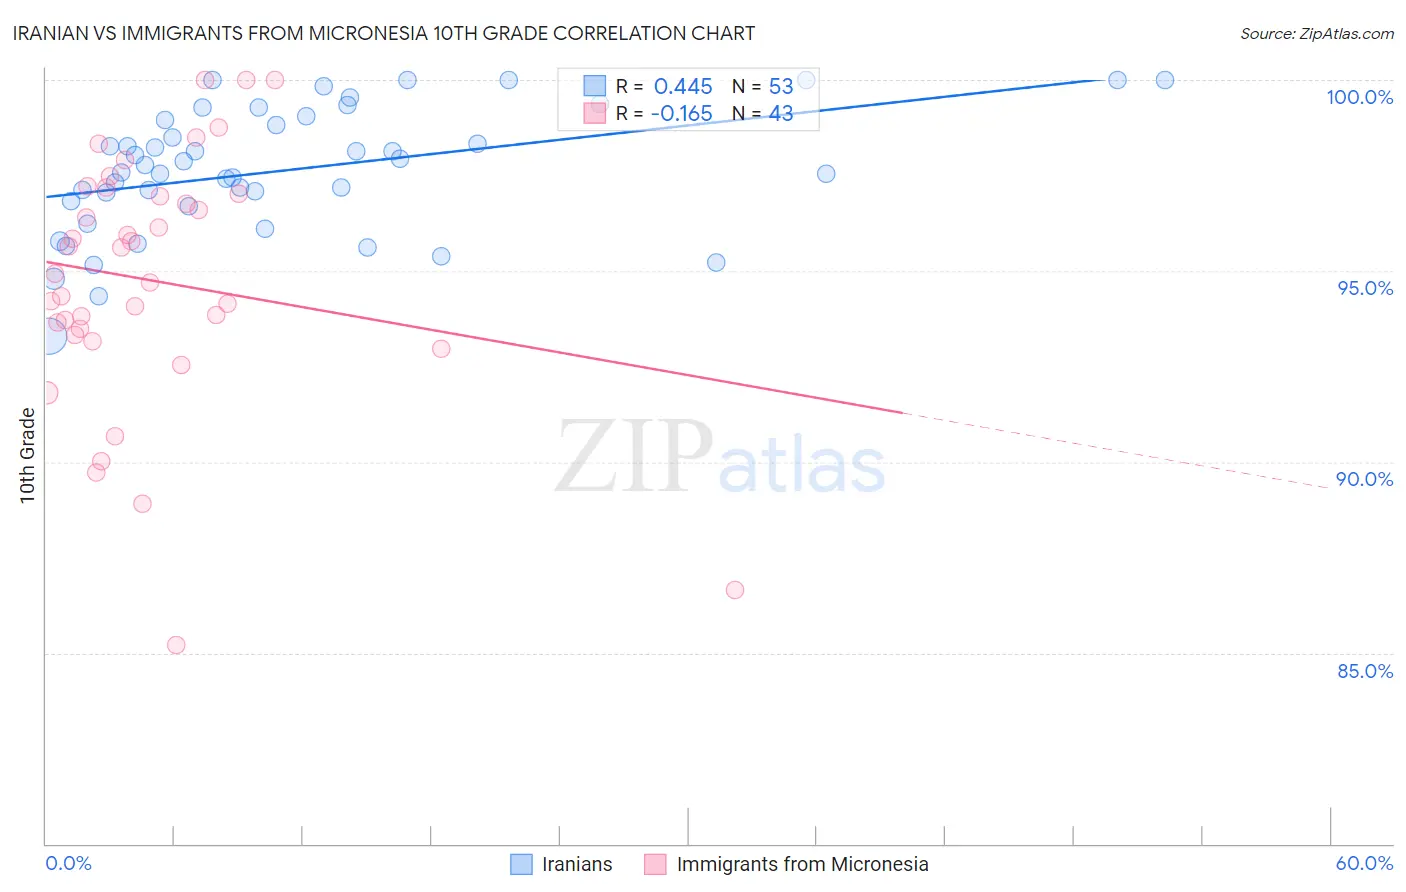
Iranian vs Immigrants from Micronesia 10th Grade Correlation Chart
The statistical analysis conducted on geographies consisting of 310,636,461 people shows a moderate positive correlation between the proportion of Iranians and percentage of population with at least 10th grade education in the United States with a correlation coefficient (R) of 0.445 and weighted average of 95.3%. Similarly, the statistical analysis conducted on geographies consisting of 61,604,657 people shows a poor negative correlation between the proportion of Immigrants from Micronesia and percentage of population with at least 10th grade education in the United States with a correlation coefficient (R) of -0.165 and weighted average of 93.5%, a difference of 2.0%.
10th Grade Correlation Summary
| Measurement | Iranian | Immigrants from Micronesia |
| Minimum | 93.3% | 85.2% |
| Maximum | 100.0% | 100.0% |
| Range | 6.7% | 14.8% |
| Mean | 97.7% | 94.7% |
| Median | 97.8% | 94.9% |
| Interquartile 25% (IQ1) | 96.8% | 93.3% |
| Interquartile 75% (IQ3) | 99.0% | 97.0% |
| Interquartile Range (IQR) | 2.2% | 3.7% |
| Standard Deviation (Sample) | 1.6% | 3.3% |
| Standard Deviation (Population) | 1.6% | 3.3% |
Similar Demographics by 10th Grade
Demographics Similar to Iranians by 10th Grade
In terms of 10th grade, the demographic groups most similar to Iranians are Hungarian (95.3%, a difference of 0.0%), French (95.3%, a difference of 0.0%), British (95.3%, a difference of 0.010%), Belgian (95.4%, a difference of 0.020%), and Estonian (95.3%, a difference of 0.020%).
| Demographics | Rating | Rank | 10th Grade |
| Europeans | 100.0 /100 | #24 | Exceptional 95.5% |
| Maltese | 100.0 /100 | #25 | Exceptional 95.5% |
| Welsh | 100.0 /100 | #26 | Exceptional 95.5% |
| Alaskan Athabascans | 100.0 /100 | #27 | Exceptional 95.4% |
| Luxembourgers | 100.0 /100 | #28 | Exceptional 95.4% |
| Bulgarians | 100.0 /100 | #29 | Exceptional 95.4% |
| Belgians | 100.0 /100 | #30 | Exceptional 95.4% |
| Iranians | 100.0 /100 | #31 | Exceptional 95.3% |
| Hungarians | 100.0 /100 | #32 | Exceptional 95.3% |
| French | 100.0 /100 | #33 | Exceptional 95.3% |
| British | 99.9 /100 | #34 | Exceptional 95.3% |
| Estonians | 99.9 /100 | #35 | Exceptional 95.3% |
| Immigrants | India | 99.9 /100 | #36 | Exceptional 95.3% |
| French Canadians | 99.9 /100 | #37 | Exceptional 95.3% |
| Northern Europeans | 99.9 /100 | #38 | Exceptional 95.3% |
Demographics Similar to Immigrants from Micronesia by 10th Grade
In terms of 10th grade, the demographic groups most similar to Immigrants from Micronesia are Asian (93.5%, a difference of 0.0%), Pueblo (93.5%, a difference of 0.010%), Hopi (93.5%, a difference of 0.010%), Hawaiian (93.5%, a difference of 0.020%), and Moroccan (93.5%, a difference of 0.030%).
| Demographics | Rating | Rank | 10th Grade |
| Yup'ik | 31.1 /100 | #191 | Fair 93.6% |
| Immigrants | Malaysia | 28.0 /100 | #192 | Fair 93.5% |
| Panamanians | 28.0 /100 | #193 | Fair 93.5% |
| Immigrants | Morocco | 26.9 /100 | #194 | Fair 93.5% |
| Cheyenne | 26.8 /100 | #195 | Fair 93.5% |
| Moroccans | 25.3 /100 | #196 | Fair 93.5% |
| Pueblo | 23.9 /100 | #197 | Fair 93.5% |
| Immigrants | Micronesia | 23.2 /100 | #198 | Fair 93.5% |
| Asians | 23.0 /100 | #199 | Fair 93.5% |
| Hopi | 22.2 /100 | #200 | Fair 93.5% |
| Hawaiians | 21.8 /100 | #201 | Fair 93.5% |
| Immigrants | Uganda | 20.9 /100 | #202 | Fair 93.5% |
| Immigrants | Western Asia | 20.6 /100 | #203 | Fair 93.4% |
| Ute | 20.3 /100 | #204 | Fair 93.4% |
| Immigrants | Indonesia | 20.2 /100 | #205 | Fair 93.4% |