Iranian vs Kiowa 10th Grade
COMPARE
Iranian
Kiowa
10th Grade
10th Grade Comparison
Iranians
Kiowa
95.3%
10TH GRADE
100.0/ 100
METRIC RATING
31st/ 347
METRIC RANK
93.9%
10TH GRADE
73.3/ 100
METRIC RATING
157th/ 347
METRIC RANK
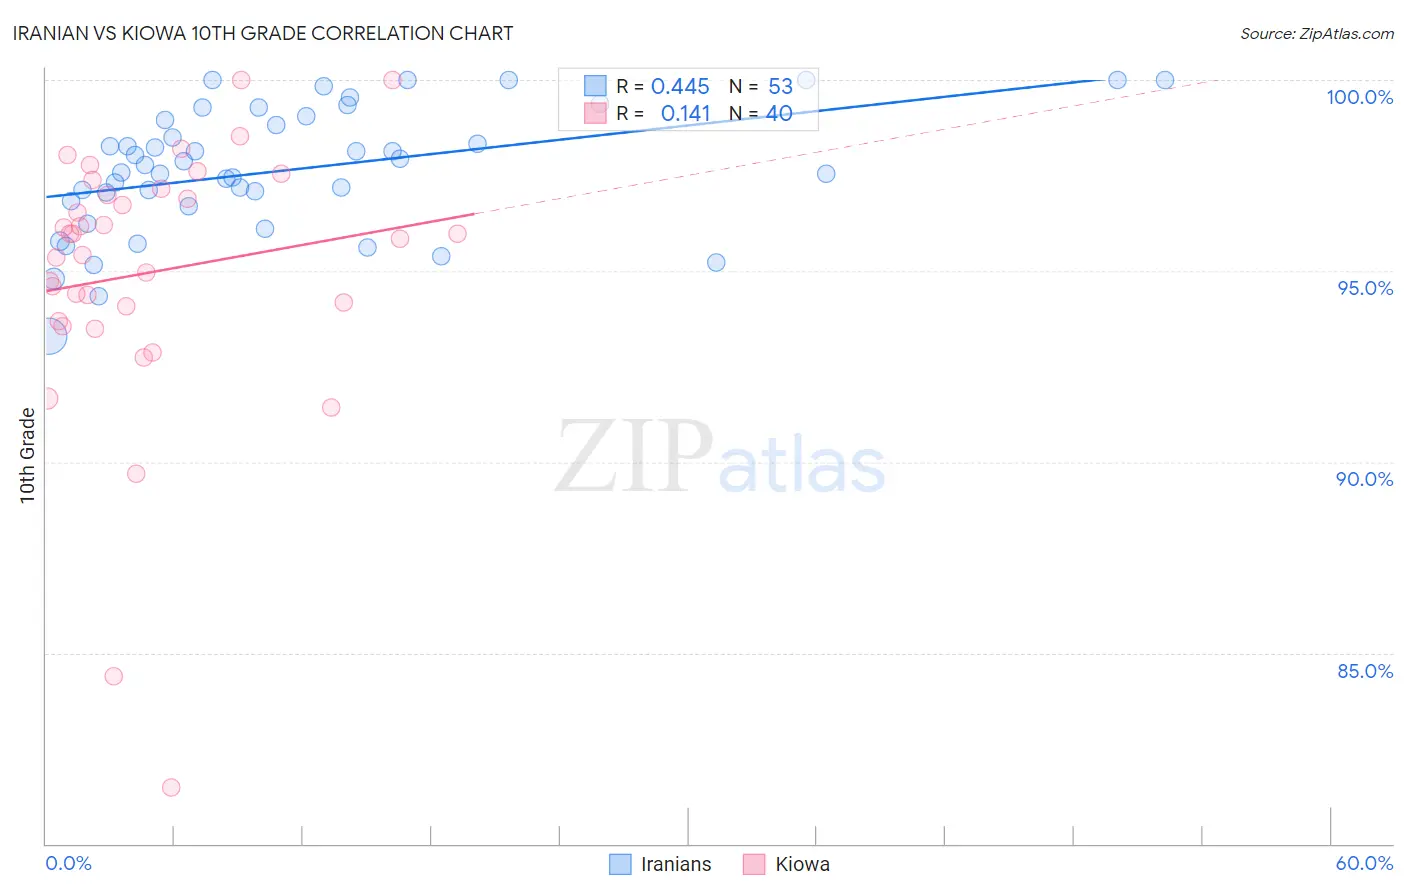
Iranian vs Kiowa 10th Grade Correlation Chart
The statistical analysis conducted on geographies consisting of 310,636,461 people shows a moderate positive correlation between the proportion of Iranians and percentage of population with at least 10th grade education in the United States with a correlation coefficient (R) of 0.445 and weighted average of 95.3%. Similarly, the statistical analysis conducted on geographies consisting of 56,101,759 people shows a poor positive correlation between the proportion of Kiowa and percentage of population with at least 10th grade education in the United States with a correlation coefficient (R) of 0.141 and weighted average of 93.9%, a difference of 1.5%.
10th Grade Correlation Summary
| Measurement | Iranian | Kiowa |
| Minimum | 93.3% | 81.5% |
| Maximum | 100.0% | 100.0% |
| Range | 6.7% | 18.5% |
| Mean | 97.7% | 95.0% |
| Median | 97.8% | 95.9% |
| Interquartile 25% (IQ1) | 96.8% | 93.9% |
| Interquartile 75% (IQ3) | 99.0% | 97.1% |
| Interquartile Range (IQR) | 2.2% | 3.2% |
| Standard Deviation (Sample) | 1.6% | 3.6% |
| Standard Deviation (Population) | 1.6% | 3.5% |
Similar Demographics by 10th Grade
Demographics Similar to Iranians by 10th Grade
In terms of 10th grade, the demographic groups most similar to Iranians are Hungarian (95.3%, a difference of 0.0%), French (95.3%, a difference of 0.0%), British (95.3%, a difference of 0.010%), Belgian (95.4%, a difference of 0.020%), and Estonian (95.3%, a difference of 0.020%).
| Demographics | Rating | Rank | 10th Grade |
| Europeans | 100.0 /100 | #24 | Exceptional 95.5% |
| Maltese | 100.0 /100 | #25 | Exceptional 95.5% |
| Welsh | 100.0 /100 | #26 | Exceptional 95.5% |
| Alaskan Athabascans | 100.0 /100 | #27 | Exceptional 95.4% |
| Luxembourgers | 100.0 /100 | #28 | Exceptional 95.4% |
| Bulgarians | 100.0 /100 | #29 | Exceptional 95.4% |
| Belgians | 100.0 /100 | #30 | Exceptional 95.4% |
| Iranians | 100.0 /100 | #31 | Exceptional 95.3% |
| Hungarians | 100.0 /100 | #32 | Exceptional 95.3% |
| French | 100.0 /100 | #33 | Exceptional 95.3% |
| British | 99.9 /100 | #34 | Exceptional 95.3% |
| Estonians | 99.9 /100 | #35 | Exceptional 95.3% |
| Immigrants | India | 99.9 /100 | #36 | Exceptional 95.3% |
| French Canadians | 99.9 /100 | #37 | Exceptional 95.3% |
| Northern Europeans | 99.9 /100 | #38 | Exceptional 95.3% |
Demographics Similar to Kiowa by 10th Grade
In terms of 10th grade, the demographic groups most similar to Kiowa are Mongolian (94.0%, a difference of 0.010%), Immigrants from Kenya (94.0%, a difference of 0.020%), Spanish (94.0%, a difference of 0.020%), Immigrants from Brazil (94.0%, a difference of 0.030%), and Bermudan (93.9%, a difference of 0.030%).
| Demographics | Rating | Rank | 10th Grade |
| Egyptians | 79.6 /100 | #150 | Good 94.0% |
| Kenyans | 79.1 /100 | #151 | Good 94.0% |
| Immigrants | Italy | 78.0 /100 | #152 | Good 94.0% |
| Immigrants | Brazil | 75.5 /100 | #153 | Good 94.0% |
| Immigrants | Kenya | 75.3 /100 | #154 | Good 94.0% |
| Spanish | 74.9 /100 | #155 | Good 94.0% |
| Mongolians | 74.4 /100 | #156 | Good 94.0% |
| Kiowa | 73.3 /100 | #157 | Good 93.9% |
| Bermudans | 71.0 /100 | #158 | Good 93.9% |
| Chileans | 70.2 /100 | #159 | Good 93.9% |
| Pakistanis | 70.1 /100 | #160 | Good 93.9% |
| Assyrians/Chaldeans/Syriacs | 69.7 /100 | #161 | Good 93.9% |
| Immigrants | Poland | 69.6 /100 | #162 | Good 93.9% |
| Venezuelans | 69.5 /100 | #163 | Good 93.9% |
| Iraqis | 68.1 /100 | #164 | Good 93.9% |