Argentinean vs Immigrants from Micronesia 10th Grade
COMPARE
Argentinean
Immigrants from Micronesia
10th Grade
10th Grade Comparison
Argentineans
Immigrants from Micronesia
93.7%
10TH GRADE
50.0/ 100
METRIC RATING
174th/ 347
METRIC RANK
93.5%
10TH GRADE
23.2/ 100
METRIC RATING
198th/ 347
METRIC RANK
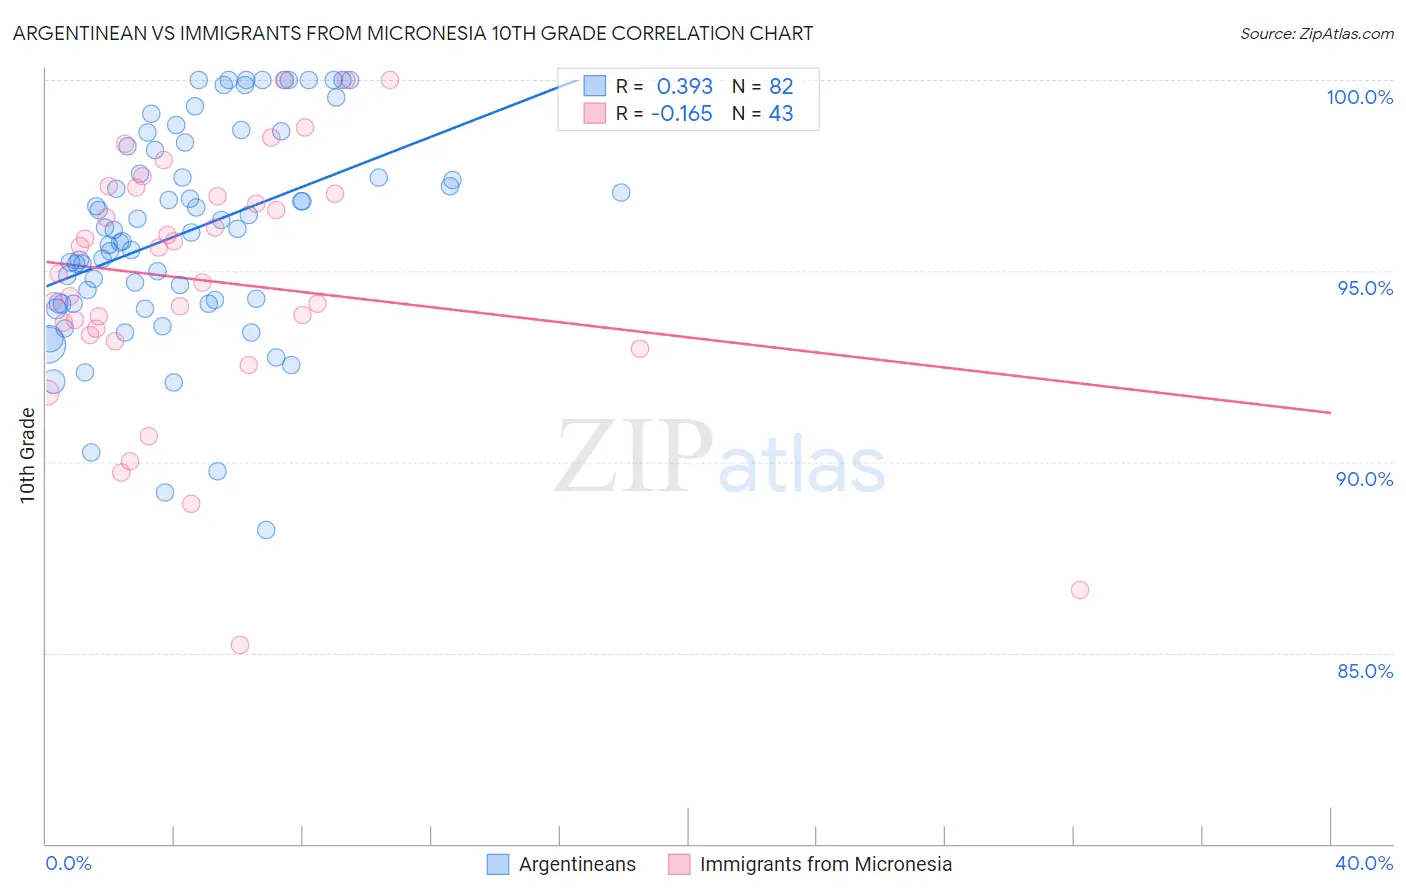
Argentinean vs Immigrants from Micronesia 10th Grade Correlation Chart
The statistical analysis conducted on geographies consisting of 297,145,104 people shows a mild positive correlation between the proportion of Argentineans and percentage of population with at least 10th grade education in the United States with a correlation coefficient (R) of 0.393 and weighted average of 93.7%. Similarly, the statistical analysis conducted on geographies consisting of 61,604,657 people shows a poor negative correlation between the proportion of Immigrants from Micronesia and percentage of population with at least 10th grade education in the United States with a correlation coefficient (R) of -0.165 and weighted average of 93.5%, a difference of 0.27%.
10th Grade Correlation Summary
| Measurement | Argentinean | Immigrants from Micronesia |
| Minimum | 88.2% | 85.2% |
| Maximum | 100.0% | 100.0% |
| Range | 11.8% | 14.8% |
| Mean | 96.0% | 94.7% |
| Median | 96.1% | 94.9% |
| Interquartile 25% (IQ1) | 94.2% | 93.3% |
| Interquartile 75% (IQ3) | 98.3% | 97.0% |
| Interquartile Range (IQR) | 4.1% | 3.7% |
| Standard Deviation (Sample) | 2.8% | 3.3% |
| Standard Deviation (Population) | 2.7% | 3.3% |
Similar Demographics by 10th Grade
Demographics Similar to Argentineans by 10th Grade
In terms of 10th grade, the demographic groups most similar to Argentineans are Spaniard (93.7%, a difference of 0.0%), Immigrants from Nepal (93.7%, a difference of 0.0%), French American Indian (93.7%, a difference of 0.010%), Immigrants from Albania (93.8%, a difference of 0.020%), and Immigrants from Venezuela (93.8%, a difference of 0.030%).
| Demographics | Rating | Rank | 10th Grade |
| Immigrants | Egypt | 62.3 /100 | #167 | Good 93.8% |
| Alsatians | 59.4 /100 | #168 | Average 93.8% |
| Immigrants | Spain | 55.9 /100 | #169 | Average 93.8% |
| Immigrants | Venezuela | 53.9 /100 | #170 | Average 93.8% |
| Immigrants | Albania | 52.4 /100 | #171 | Average 93.8% |
| French American Indians | 50.9 /100 | #172 | Average 93.7% |
| Spaniards | 50.3 /100 | #173 | Average 93.7% |
| Argentineans | 50.0 /100 | #174 | Average 93.7% |
| Immigrants | Nepal | 49.6 /100 | #175 | Average 93.7% |
| Immigrants | Argentina | 47.1 /100 | #176 | Average 93.7% |
| Immigrants | Lebanon | 47.1 /100 | #177 | Average 93.7% |
| Sierra Leoneans | 46.1 /100 | #178 | Average 93.7% |
| Paraguayans | 45.3 /100 | #179 | Average 93.7% |
| Blackfeet | 42.8 /100 | #180 | Average 93.7% |
| Immigrants | Northern Africa | 41.6 /100 | #181 | Average 93.7% |
Demographics Similar to Immigrants from Micronesia by 10th Grade
In terms of 10th grade, the demographic groups most similar to Immigrants from Micronesia are Asian (93.5%, a difference of 0.0%), Pueblo (93.5%, a difference of 0.010%), Hopi (93.5%, a difference of 0.010%), Hawaiian (93.5%, a difference of 0.020%), and Moroccan (93.5%, a difference of 0.030%).
| Demographics | Rating | Rank | 10th Grade |
| Yup'ik | 31.1 /100 | #191 | Fair 93.6% |
| Immigrants | Malaysia | 28.0 /100 | #192 | Fair 93.5% |
| Panamanians | 28.0 /100 | #193 | Fair 93.5% |
| Immigrants | Morocco | 26.9 /100 | #194 | Fair 93.5% |
| Cheyenne | 26.8 /100 | #195 | Fair 93.5% |
| Moroccans | 25.3 /100 | #196 | Fair 93.5% |
| Pueblo | 23.9 /100 | #197 | Fair 93.5% |
| Immigrants | Micronesia | 23.2 /100 | #198 | Fair 93.5% |
| Asians | 23.0 /100 | #199 | Fair 93.5% |
| Hopi | 22.2 /100 | #200 | Fair 93.5% |
| Hawaiians | 21.8 /100 | #201 | Fair 93.5% |
| Immigrants | Uganda | 20.9 /100 | #202 | Fair 93.5% |
| Immigrants | Western Asia | 20.6 /100 | #203 | Fair 93.4% |
| Ute | 20.3 /100 | #204 | Fair 93.4% |
| Immigrants | Indonesia | 20.2 /100 | #205 | Fair 93.4% |