Iranian vs Immigrants from Thailand 10th Grade
COMPARE
Iranian
Immigrants from Thailand
10th Grade
10th Grade Comparison
Iranians
Immigrants from Thailand
95.3%
10TH GRADE
100.0/ 100
METRIC RATING
31st/ 347
METRIC RANK
92.8%
10TH GRADE
1.0/ 100
METRIC RATING
251st/ 347
METRIC RANK
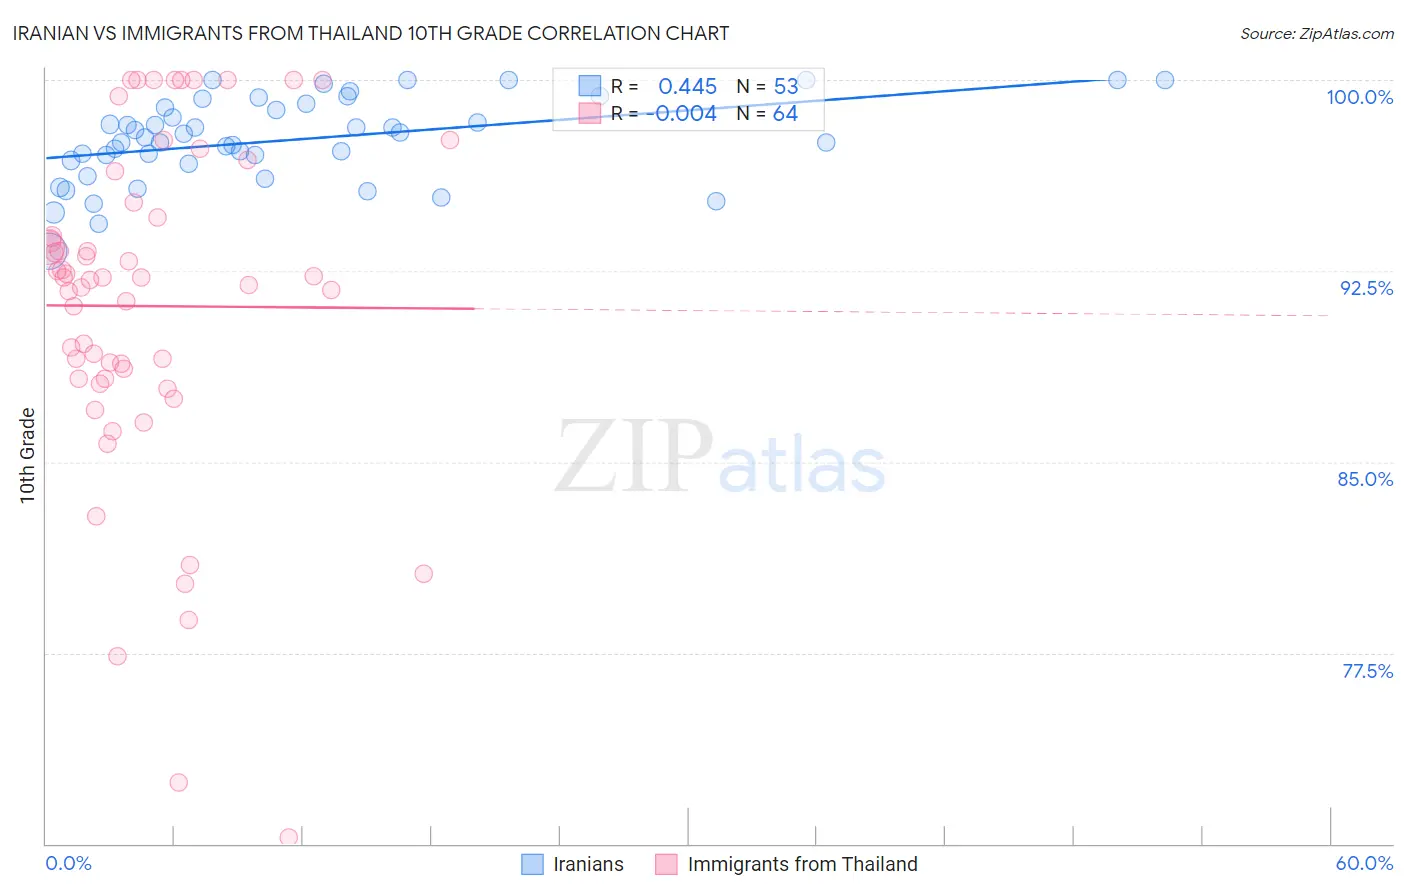
Iranian vs Immigrants from Thailand 10th Grade Correlation Chart
The statistical analysis conducted on geographies consisting of 310,636,461 people shows a moderate positive correlation between the proportion of Iranians and percentage of population with at least 10th grade education in the United States with a correlation coefficient (R) of 0.445 and weighted average of 95.3%. Similarly, the statistical analysis conducted on geographies consisting of 317,022,916 people shows no correlation between the proportion of Immigrants from Thailand and percentage of population with at least 10th grade education in the United States with a correlation coefficient (R) of -0.004 and weighted average of 92.8%, a difference of 2.8%.
10th Grade Correlation Summary
| Measurement | Iranian | Immigrants from Thailand |
| Minimum | 93.3% | 70.3% |
| Maximum | 100.0% | 100.0% |
| Range | 6.7% | 29.7% |
| Mean | 97.7% | 91.1% |
| Median | 97.8% | 92.2% |
| Interquartile 25% (IQ1) | 96.8% | 88.3% |
| Interquartile 75% (IQ3) | 99.0% | 94.9% |
| Interquartile Range (IQR) | 2.2% | 6.6% |
| Standard Deviation (Sample) | 1.6% | 6.6% |
| Standard Deviation (Population) | 1.6% | 6.5% |
Similar Demographics by 10th Grade
Demographics Similar to Iranians by 10th Grade
In terms of 10th grade, the demographic groups most similar to Iranians are Hungarian (95.3%, a difference of 0.0%), French (95.3%, a difference of 0.0%), British (95.3%, a difference of 0.010%), Belgian (95.4%, a difference of 0.020%), and Estonian (95.3%, a difference of 0.020%).
| Demographics | Rating | Rank | 10th Grade |
| Europeans | 100.0 /100 | #24 | Exceptional 95.5% |
| Maltese | 100.0 /100 | #25 | Exceptional 95.5% |
| Welsh | 100.0 /100 | #26 | Exceptional 95.5% |
| Alaskan Athabascans | 100.0 /100 | #27 | Exceptional 95.4% |
| Luxembourgers | 100.0 /100 | #28 | Exceptional 95.4% |
| Bulgarians | 100.0 /100 | #29 | Exceptional 95.4% |
| Belgians | 100.0 /100 | #30 | Exceptional 95.4% |
| Iranians | 100.0 /100 | #31 | Exceptional 95.3% |
| Hungarians | 100.0 /100 | #32 | Exceptional 95.3% |
| French | 100.0 /100 | #33 | Exceptional 95.3% |
| British | 99.9 /100 | #34 | Exceptional 95.3% |
| Estonians | 99.9 /100 | #35 | Exceptional 95.3% |
| Immigrants | India | 99.9 /100 | #36 | Exceptional 95.3% |
| French Canadians | 99.9 /100 | #37 | Exceptional 95.3% |
| Northern Europeans | 99.9 /100 | #38 | Exceptional 95.3% |
Demographics Similar to Immigrants from Thailand by 10th Grade
In terms of 10th grade, the demographic groups most similar to Immigrants from Thailand are South American (92.8%, a difference of 0.010%), Ghanaian (92.8%, a difference of 0.010%), Armenian (92.7%, a difference of 0.020%), Jamaican (92.8%, a difference of 0.050%), and Immigrants from Bolivia (92.7%, a difference of 0.070%).
| Demographics | Rating | Rank | 10th Grade |
| Spanish Americans | 2.1 /100 | #244 | Tragic 92.9% |
| Uruguayans | 1.8 /100 | #245 | Tragic 92.9% |
| Immigrants | Middle Africa | 1.7 /100 | #246 | Tragic 92.9% |
| Immigrants | Afghanistan | 1.4 /100 | #247 | Tragic 92.8% |
| Colombians | 1.4 /100 | #248 | Tragic 92.8% |
| Immigrants | Senegal | 1.4 /100 | #249 | Tragic 92.8% |
| Jamaicans | 1.2 /100 | #250 | Tragic 92.8% |
| Immigrants | Thailand | 1.0 /100 | #251 | Tragic 92.8% |
| South Americans | 0.9 /100 | #252 | Tragic 92.8% |
| Ghanaians | 0.9 /100 | #253 | Tragic 92.8% |
| Armenians | 0.9 /100 | #254 | Tragic 92.7% |
| Immigrants | Bolivia | 0.7 /100 | #255 | Tragic 92.7% |
| Immigrants | Nigeria | 0.7 /100 | #256 | Tragic 92.7% |
| U.S. Virgin Islanders | 0.7 /100 | #257 | Tragic 92.7% |
| Immigrants | Costa Rica | 0.6 /100 | #258 | Tragic 92.7% |