Immigrants from Uzbekistan vs Immigrants from Micronesia 10th Grade
COMPARE
Immigrants from Uzbekistan
Immigrants from Micronesia
10th Grade
10th Grade Comparison
Immigrants from Uzbekistan
Immigrants from Micronesia
92.6%
10TH GRADE
0.5/ 100
METRIC RATING
260th/ 347
METRIC RANK
93.5%
10TH GRADE
23.2/ 100
METRIC RATING
198th/ 347
METRIC RANK
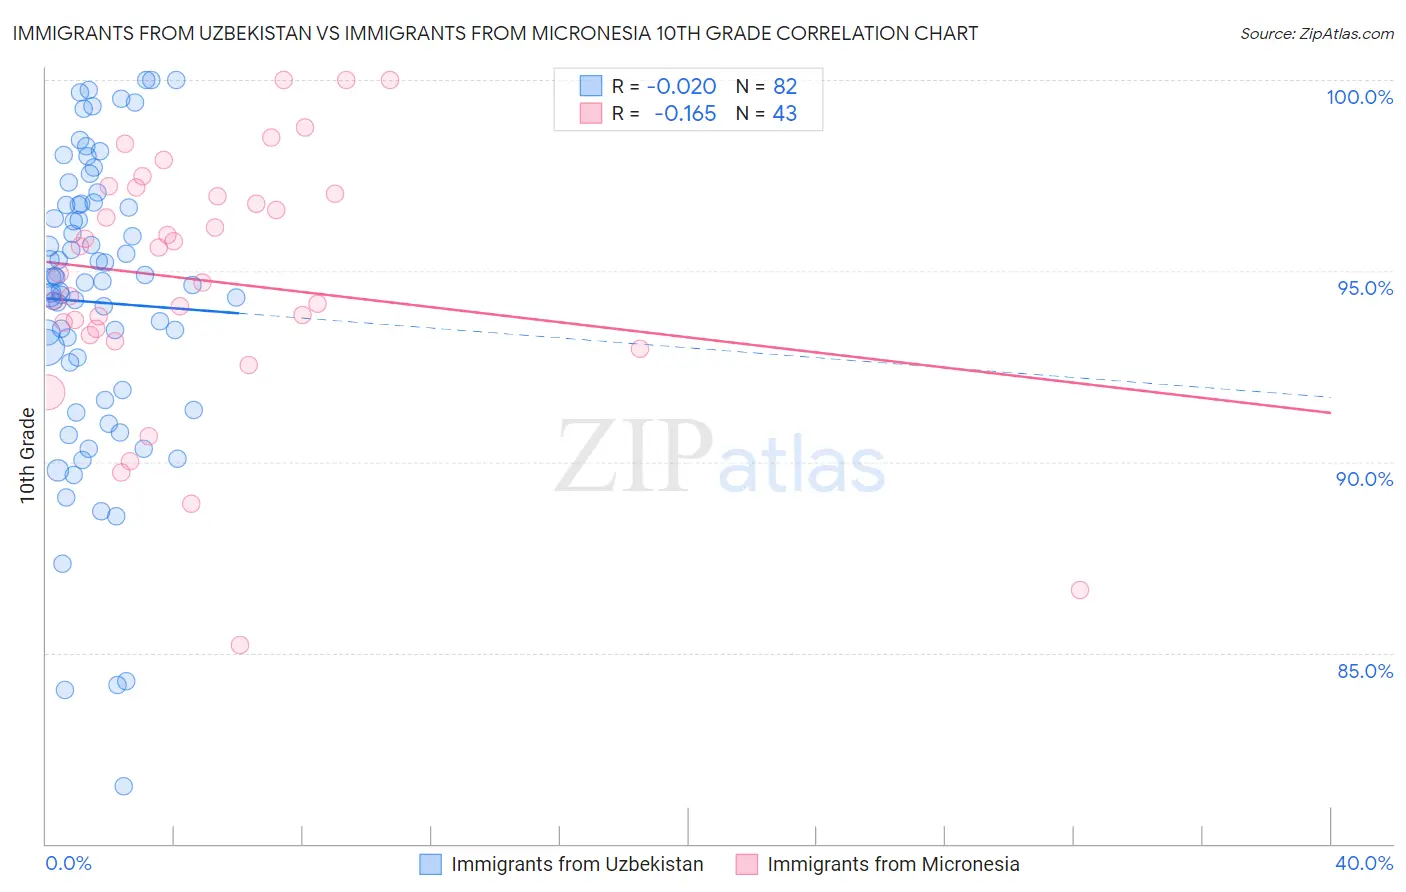
Immigrants from Uzbekistan vs Immigrants from Micronesia 10th Grade Correlation Chart
The statistical analysis conducted on geographies consisting of 118,684,730 people shows no correlation between the proportion of Immigrants from Uzbekistan and percentage of population with at least 10th grade education in the United States with a correlation coefficient (R) of -0.020 and weighted average of 92.6%. Similarly, the statistical analysis conducted on geographies consisting of 61,604,657 people shows a poor negative correlation between the proportion of Immigrants from Micronesia and percentage of population with at least 10th grade education in the United States with a correlation coefficient (R) of -0.165 and weighted average of 93.5%, a difference of 0.92%.
10th Grade Correlation Summary
| Measurement | Immigrants from Uzbekistan | Immigrants from Micronesia |
| Minimum | 81.5% | 85.2% |
| Maximum | 100.0% | 100.0% |
| Range | 18.5% | 14.8% |
| Mean | 94.2% | 94.7% |
| Median | 94.7% | 94.9% |
| Interquartile 25% (IQ1) | 91.9% | 93.3% |
| Interquartile 75% (IQ3) | 96.7% | 97.0% |
| Interquartile Range (IQR) | 4.8% | 3.7% |
| Standard Deviation (Sample) | 3.9% | 3.3% |
| Standard Deviation (Population) | 3.9% | 3.3% |
Similar Demographics by 10th Grade
Demographics Similar to Immigrants from Uzbekistan by 10th Grade
In terms of 10th grade, the demographic groups most similar to Immigrants from Uzbekistan are Immigrants from Jamaica (92.6%, a difference of 0.010%), Paiute (92.6%, a difference of 0.040%), Immigrants from Costa Rica (92.7%, a difference of 0.050%), Immigrants from South America (92.6%, a difference of 0.050%), and Apache (92.6%, a difference of 0.050%).
| Demographics | Rating | Rank | 10th Grade |
| Ghanaians | 0.9 /100 | #253 | Tragic 92.8% |
| Armenians | 0.9 /100 | #254 | Tragic 92.7% |
| Immigrants | Bolivia | 0.7 /100 | #255 | Tragic 92.7% |
| Immigrants | Nigeria | 0.7 /100 | #256 | Tragic 92.7% |
| U.S. Virgin Islanders | 0.7 /100 | #257 | Tragic 92.7% |
| Immigrants | Costa Rica | 0.6 /100 | #258 | Tragic 92.7% |
| Immigrants | Jamaica | 0.5 /100 | #259 | Tragic 92.6% |
| Immigrants | Uzbekistan | 0.5 /100 | #260 | Tragic 92.6% |
| Paiute | 0.4 /100 | #261 | Tragic 92.6% |
| Immigrants | South America | 0.4 /100 | #262 | Tragic 92.6% |
| Apache | 0.4 /100 | #263 | Tragic 92.6% |
| Peruvians | 0.4 /100 | #264 | Tragic 92.6% |
| Dutch West Indians | 0.4 /100 | #265 | Tragic 92.6% |
| Immigrants | Philippines | 0.4 /100 | #266 | Tragic 92.6% |
| Taiwanese | 0.3 /100 | #267 | Tragic 92.5% |
Demographics Similar to Immigrants from Micronesia by 10th Grade
In terms of 10th grade, the demographic groups most similar to Immigrants from Micronesia are Asian (93.5%, a difference of 0.0%), Pueblo (93.5%, a difference of 0.010%), Hopi (93.5%, a difference of 0.010%), Hawaiian (93.5%, a difference of 0.020%), and Moroccan (93.5%, a difference of 0.030%).
| Demographics | Rating | Rank | 10th Grade |
| Yup'ik | 31.1 /100 | #191 | Fair 93.6% |
| Immigrants | Malaysia | 28.0 /100 | #192 | Fair 93.5% |
| Panamanians | 28.0 /100 | #193 | Fair 93.5% |
| Immigrants | Morocco | 26.9 /100 | #194 | Fair 93.5% |
| Cheyenne | 26.8 /100 | #195 | Fair 93.5% |
| Moroccans | 25.3 /100 | #196 | Fair 93.5% |
| Pueblo | 23.9 /100 | #197 | Fair 93.5% |
| Immigrants | Micronesia | 23.2 /100 | #198 | Fair 93.5% |
| Asians | 23.0 /100 | #199 | Fair 93.5% |
| Hopi | 22.2 /100 | #200 | Fair 93.5% |
| Hawaiians | 21.8 /100 | #201 | Fair 93.5% |
| Immigrants | Uganda | 20.9 /100 | #202 | Fair 93.5% |
| Immigrants | Western Asia | 20.6 /100 | #203 | Fair 93.4% |
| Ute | 20.3 /100 | #204 | Fair 93.4% |
| Immigrants | Indonesia | 20.2 /100 | #205 | Fair 93.4% |