Iranian vs Immigrants from Micronesia 7th Grade
COMPARE
Iranian
Immigrants from Micronesia
7th Grade
7th Grade Comparison
Iranians
Immigrants from Micronesia
96.8%
7TH GRADE
99.6/ 100
METRIC RATING
69th/ 347
METRIC RANK
95.9%
7TH GRADE
32.6/ 100
METRIC RATING
190th/ 347
METRIC RANK
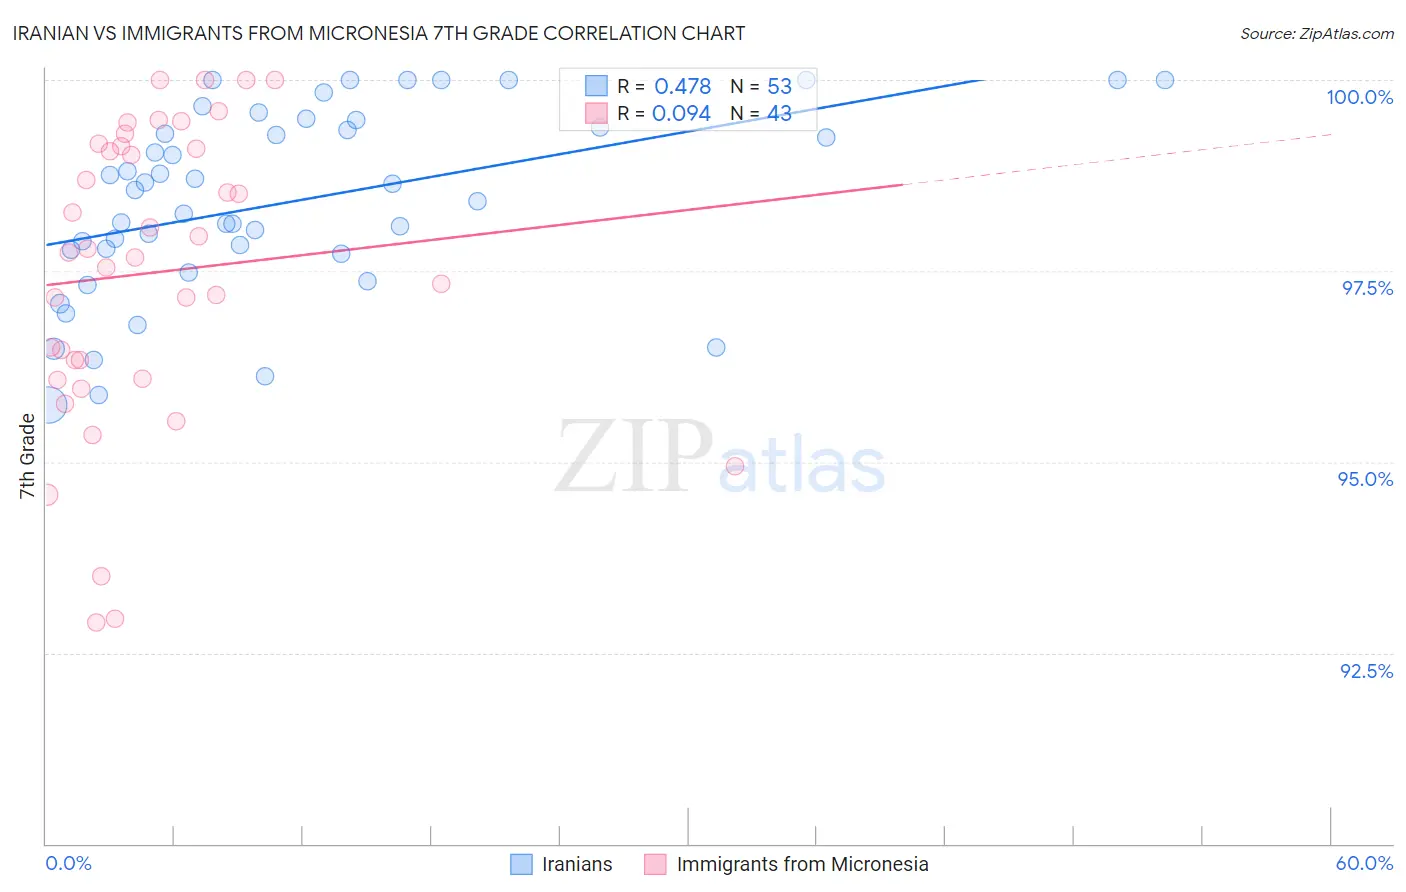
Iranian vs Immigrants from Micronesia 7th Grade Correlation Chart
The statistical analysis conducted on geographies consisting of 310,636,461 people shows a moderate positive correlation between the proportion of Iranians and percentage of population with at least 7th grade education in the United States with a correlation coefficient (R) of 0.478 and weighted average of 96.8%. Similarly, the statistical analysis conducted on geographies consisting of 61,604,657 people shows a slight positive correlation between the proportion of Immigrants from Micronesia and percentage of population with at least 7th grade education in the United States with a correlation coefficient (R) of 0.094 and weighted average of 95.9%, a difference of 0.95%.
7th Grade Correlation Summary
| Measurement | Iranian | Immigrants from Micronesia |
| Minimum | 95.7% | 92.9% |
| Maximum | 100.0% | 100.0% |
| Range | 4.3% | 7.1% |
| Mean | 98.4% | 97.5% |
| Median | 98.6% | 97.7% |
| Interquartile 25% (IQ1) | 97.8% | 96.1% |
| Interquartile 75% (IQ3) | 99.4% | 99.1% |
| Interquartile Range (IQR) | 1.7% | 3.1% |
| Standard Deviation (Sample) | 1.2% | 1.9% |
| Standard Deviation (Population) | 1.2% | 1.9% |
Similar Demographics by 7th Grade
Demographics Similar to Iranians by 7th Grade
In terms of 7th grade, the demographic groups most similar to Iranians are New Zealander (96.8%, a difference of 0.0%), Immigrants from Lithuania (96.8%, a difference of 0.010%), Immigrants from India (96.9%, a difference of 0.020%), Cajun (96.8%, a difference of 0.020%), and Arapaho (96.8%, a difference of 0.030%).
| Demographics | Rating | Rank | 7th Grade |
| Immigrants | North America | 99.8 /100 | #62 | Exceptional 96.9% |
| Immigrants | Northern Europe | 99.7 /100 | #63 | Exceptional 96.9% |
| Immigrants | Austria | 99.7 /100 | #64 | Exceptional 96.9% |
| Canadians | 99.7 /100 | #65 | Exceptional 96.9% |
| Ukrainians | 99.7 /100 | #66 | Exceptional 96.9% |
| Native Hawaiians | 99.7 /100 | #67 | Exceptional 96.9% |
| Immigrants | India | 99.6 /100 | #68 | Exceptional 96.9% |
| Iranians | 99.6 /100 | #69 | Exceptional 96.8% |
| New Zealanders | 99.6 /100 | #70 | Exceptional 96.8% |
| Immigrants | Lithuania | 99.6 /100 | #71 | Exceptional 96.8% |
| Cajuns | 99.5 /100 | #72 | Exceptional 96.8% |
| Arapaho | 99.5 /100 | #73 | Exceptional 96.8% |
| Immigrants | England | 99.5 /100 | #74 | Exceptional 96.8% |
| Zimbabweans | 99.5 /100 | #75 | Exceptional 96.8% |
| Immigrants | Ireland | 99.4 /100 | #76 | Exceptional 96.8% |
Demographics Similar to Immigrants from Micronesia by 7th Grade
In terms of 7th grade, the demographic groups most similar to Immigrants from Micronesia are Liberian (95.9%, a difference of 0.0%), Panamanian (95.9%, a difference of 0.0%), Immigrants from Egypt (95.9%, a difference of 0.010%), Immigrants from Venezuela (95.9%, a difference of 0.010%), and Immigrants from Bahamas (95.9%, a difference of 0.010%).
| Demographics | Rating | Rank | 7th Grade |
| Immigrants | Spain | 38.8 /100 | #183 | Fair 96.0% |
| Sierra Leoneans | 37.5 /100 | #184 | Fair 96.0% |
| Brazilians | 37.3 /100 | #185 | Fair 96.0% |
| Immigrants | Iraq | 36.1 /100 | #186 | Fair 96.0% |
| Immigrants | Uganda | 36.0 /100 | #187 | Fair 96.0% |
| Immigrants | Egypt | 34.3 /100 | #188 | Fair 95.9% |
| Immigrants | Venezuela | 33.9 /100 | #189 | Fair 95.9% |
| Immigrants | Micronesia | 32.6 /100 | #190 | Fair 95.9% |
| Liberians | 32.5 /100 | #191 | Fair 95.9% |
| Panamanians | 32.3 /100 | #192 | Fair 95.9% |
| Immigrants | Bahamas | 30.8 /100 | #193 | Fair 95.9% |
| Immigrants | Nepal | 30.0 /100 | #194 | Fair 95.9% |
| Sudanese | 28.1 /100 | #195 | Fair 95.9% |
| Apache | 27.6 /100 | #196 | Fair 95.9% |
| Immigrants | Zaire | 26.7 /100 | #197 | Fair 95.9% |