Barbadian vs Immigrants from Micronesia 10th Grade
COMPARE
Barbadian
Immigrants from Micronesia
10th Grade
10th Grade Comparison
Barbadians
Immigrants from Micronesia
92.2%
10TH GRADE
0.1/ 100
METRIC RATING
278th/ 347
METRIC RANK
93.5%
10TH GRADE
23.2/ 100
METRIC RATING
198th/ 347
METRIC RANK
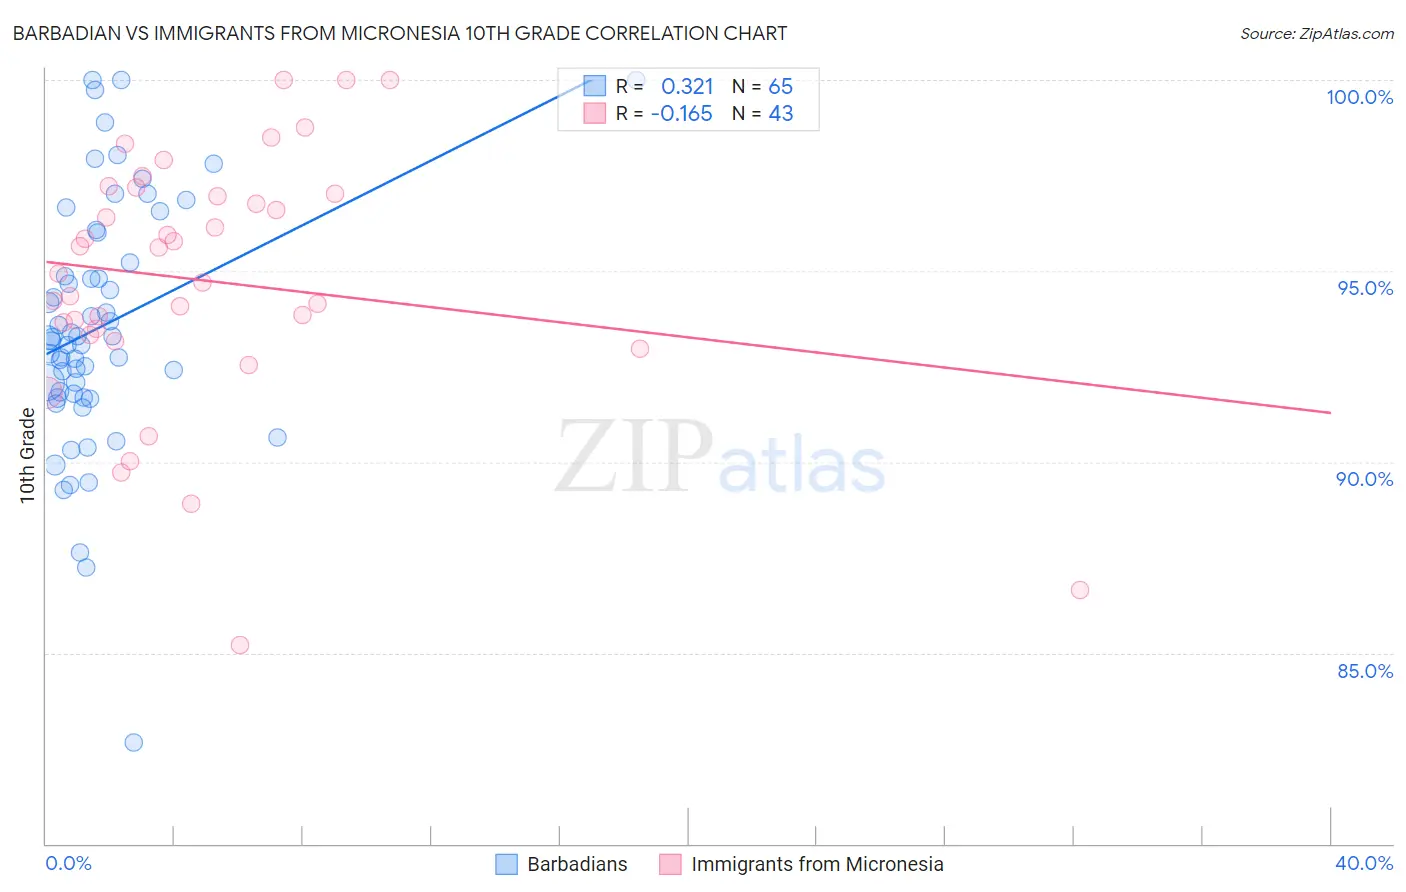
Barbadian vs Immigrants from Micronesia 10th Grade Correlation Chart
The statistical analysis conducted on geographies consisting of 141,299,083 people shows a mild positive correlation between the proportion of Barbadians and percentage of population with at least 10th grade education in the United States with a correlation coefficient (R) of 0.321 and weighted average of 92.2%. Similarly, the statistical analysis conducted on geographies consisting of 61,604,657 people shows a poor negative correlation between the proportion of Immigrants from Micronesia and percentage of population with at least 10th grade education in the United States with a correlation coefficient (R) of -0.165 and weighted average of 93.5%, a difference of 1.4%.
10th Grade Correlation Summary
| Measurement | Barbadian | Immigrants from Micronesia |
| Minimum | 82.6% | 85.2% |
| Maximum | 100.0% | 100.0% |
| Range | 17.4% | 14.8% |
| Mean | 93.5% | 94.7% |
| Median | 93.3% | 94.9% |
| Interquartile 25% (IQ1) | 91.7% | 93.3% |
| Interquartile 75% (IQ3) | 95.6% | 97.0% |
| Interquartile Range (IQR) | 3.9% | 3.7% |
| Standard Deviation (Sample) | 3.3% | 3.3% |
| Standard Deviation (Population) | 3.2% | 3.3% |
Similar Demographics by 10th Grade
Demographics Similar to Barbadians by 10th Grade
In terms of 10th grade, the demographic groups most similar to Barbadians are Native/Alaskan (92.2%, a difference of 0.010%), Navajo (92.3%, a difference of 0.040%), Malaysian (92.2%, a difference of 0.040%), Bangladeshi (92.2%, a difference of 0.040%), and Immigrants from Peru (92.2%, a difference of 0.060%).
| Demographics | Rating | Rank | 10th Grade |
| Immigrants | Eritrea | 0.3 /100 | #271 | Tragic 92.5% |
| Immigrants | Western Africa | 0.3 /100 | #272 | Tragic 92.5% |
| Trinidadians and Tobagonians | 0.2 /100 | #273 | Tragic 92.4% |
| Immigrants | Congo | 0.2 /100 | #274 | Tragic 92.4% |
| West Indians | 0.2 /100 | #275 | Tragic 92.4% |
| Immigrants | Trinidad and Tobago | 0.1 /100 | #276 | Tragic 92.3% |
| Navajo | 0.1 /100 | #277 | Tragic 92.3% |
| Barbadians | 0.1 /100 | #278 | Tragic 92.2% |
| Natives/Alaskans | 0.1 /100 | #279 | Tragic 92.2% |
| Malaysians | 0.1 /100 | #280 | Tragic 92.2% |
| Bangladeshis | 0.1 /100 | #281 | Tragic 92.2% |
| Immigrants | Peru | 0.1 /100 | #282 | Tragic 92.2% |
| Immigrants | St. Vincent and the Grenadines | 0.0 /100 | #283 | Tragic 92.1% |
| Immigrants | Barbados | 0.0 /100 | #284 | Tragic 92.1% |
| Immigrants | South Eastern Asia | 0.0 /100 | #285 | Tragic 92.1% |
Demographics Similar to Immigrants from Micronesia by 10th Grade
In terms of 10th grade, the demographic groups most similar to Immigrants from Micronesia are Asian (93.5%, a difference of 0.0%), Pueblo (93.5%, a difference of 0.010%), Hopi (93.5%, a difference of 0.010%), Hawaiian (93.5%, a difference of 0.020%), and Moroccan (93.5%, a difference of 0.030%).
| Demographics | Rating | Rank | 10th Grade |
| Yup'ik | 31.1 /100 | #191 | Fair 93.6% |
| Immigrants | Malaysia | 28.0 /100 | #192 | Fair 93.5% |
| Panamanians | 28.0 /100 | #193 | Fair 93.5% |
| Immigrants | Morocco | 26.9 /100 | #194 | Fair 93.5% |
| Cheyenne | 26.8 /100 | #195 | Fair 93.5% |
| Moroccans | 25.3 /100 | #196 | Fair 93.5% |
| Pueblo | 23.9 /100 | #197 | Fair 93.5% |
| Immigrants | Micronesia | 23.2 /100 | #198 | Fair 93.5% |
| Asians | 23.0 /100 | #199 | Fair 93.5% |
| Hopi | 22.2 /100 | #200 | Fair 93.5% |
| Hawaiians | 21.8 /100 | #201 | Fair 93.5% |
| Immigrants | Uganda | 20.9 /100 | #202 | Fair 93.5% |
| Immigrants | Western Asia | 20.6 /100 | #203 | Fair 93.4% |
| Ute | 20.3 /100 | #204 | Fair 93.4% |
| Immigrants | Indonesia | 20.2 /100 | #205 | Fair 93.4% |