Indonesian vs Immigrants from Micronesia 10th Grade
COMPARE
Indonesian
Immigrants from Micronesia
10th Grade
10th Grade Comparison
Indonesians
Immigrants from Micronesia
91.8%
10TH GRADE
0.0/ 100
METRIC RATING
293rd/ 347
METRIC RANK
93.5%
10TH GRADE
23.2/ 100
METRIC RATING
198th/ 347
METRIC RANK
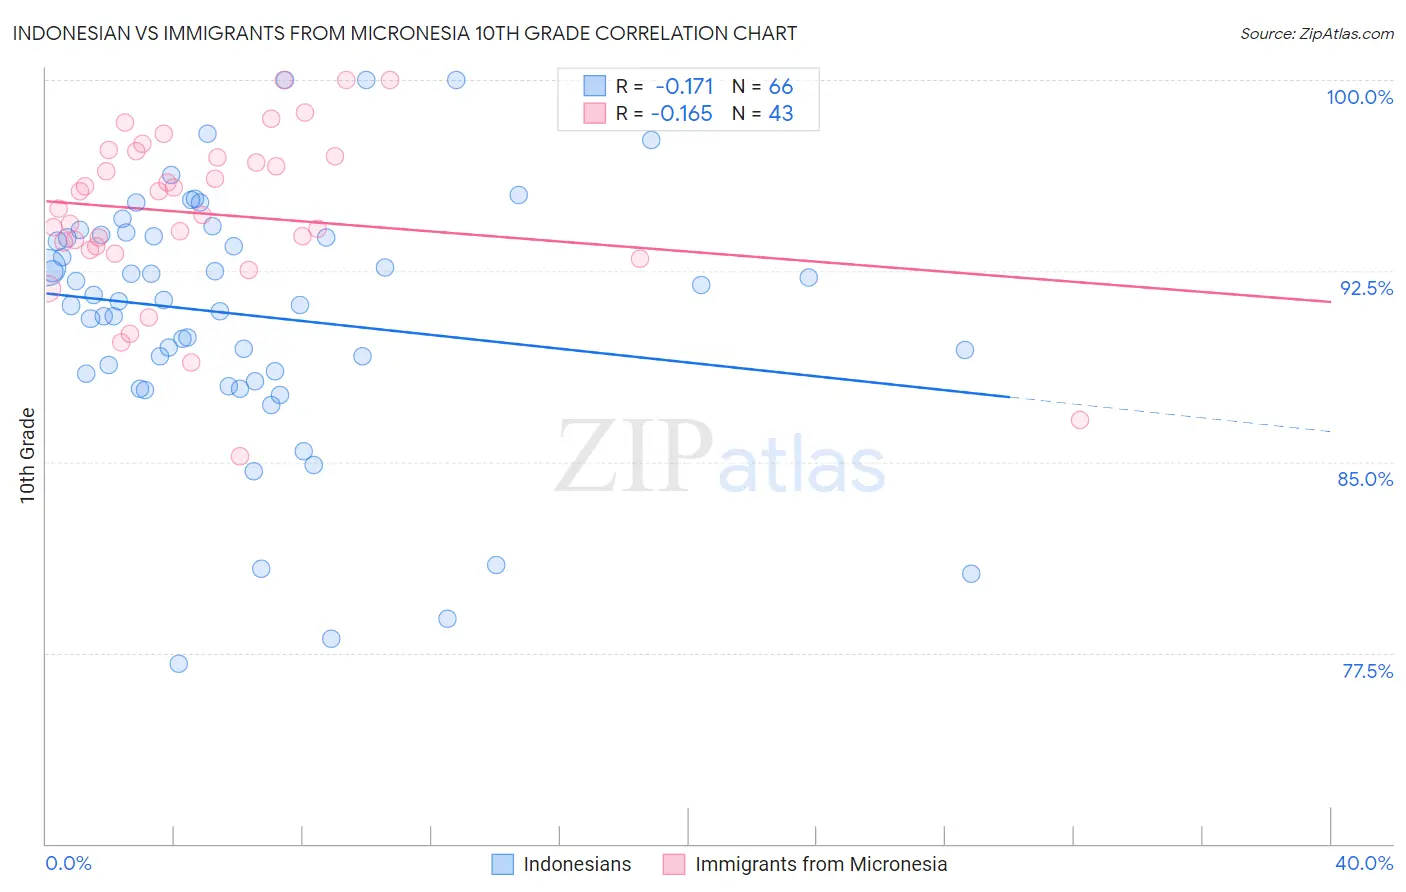
Indonesian vs Immigrants from Micronesia 10th Grade Correlation Chart
The statistical analysis conducted on geographies consisting of 162,727,113 people shows a poor negative correlation between the proportion of Indonesians and percentage of population with at least 10th grade education in the United States with a correlation coefficient (R) of -0.171 and weighted average of 91.8%. Similarly, the statistical analysis conducted on geographies consisting of 61,604,657 people shows a poor negative correlation between the proportion of Immigrants from Micronesia and percentage of population with at least 10th grade education in the United States with a correlation coefficient (R) of -0.165 and weighted average of 93.5%, a difference of 1.8%.
10th Grade Correlation Summary
| Measurement | Indonesian | Immigrants from Micronesia |
| Minimum | 77.1% | 85.2% |
| Maximum | 100.0% | 100.0% |
| Range | 22.9% | 14.8% |
| Mean | 90.7% | 94.7% |
| Median | 91.3% | 94.9% |
| Interquartile 25% (IQ1) | 88.5% | 93.3% |
| Interquartile 75% (IQ3) | 93.9% | 97.0% |
| Interquartile Range (IQR) | 5.4% | 3.7% |
| Standard Deviation (Sample) | 5.0% | 3.3% |
| Standard Deviation (Population) | 4.9% | 3.3% |
Similar Demographics by 10th Grade
Demographics Similar to Indonesians by 10th Grade
In terms of 10th grade, the demographic groups most similar to Indonesians are Immigrants from West Indies (91.8%, a difference of 0.020%), Immigrants from Burma/Myanmar (91.8%, a difference of 0.020%), British West Indian (91.8%, a difference of 0.030%), Haitian (91.8%, a difference of 0.030%), and Sri Lankan (91.8%, a difference of 0.050%).
| Demographics | Rating | Rank | 10th Grade |
| Yuman | 0.0 /100 | #286 | Tragic 92.0% |
| Pennsylvania Germans | 0.0 /100 | #287 | Tragic 91.9% |
| Immigrants | Laos | 0.0 /100 | #288 | Tragic 91.9% |
| Sri Lankans | 0.0 /100 | #289 | Tragic 91.8% |
| British West Indians | 0.0 /100 | #290 | Tragic 91.8% |
| Immigrants | West Indies | 0.0 /100 | #291 | Tragic 91.8% |
| Immigrants | Burma/Myanmar | 0.0 /100 | #292 | Tragic 91.8% |
| Indonesians | 0.0 /100 | #293 | Tragic 91.8% |
| Haitians | 0.0 /100 | #294 | Tragic 91.8% |
| Lumbee | 0.0 /100 | #295 | Tragic 91.7% |
| Immigrants | Grenada | 0.0 /100 | #296 | Tragic 91.6% |
| Fijians | 0.0 /100 | #297 | Tragic 91.5% |
| Cubans | 0.0 /100 | #298 | Tragic 91.5% |
| Immigrants | Haiti | 0.0 /100 | #299 | Tragic 91.4% |
| Guyanese | 0.0 /100 | #300 | Tragic 91.4% |
Demographics Similar to Immigrants from Micronesia by 10th Grade
In terms of 10th grade, the demographic groups most similar to Immigrants from Micronesia are Asian (93.5%, a difference of 0.0%), Pueblo (93.5%, a difference of 0.010%), Hopi (93.5%, a difference of 0.010%), Hawaiian (93.5%, a difference of 0.020%), and Moroccan (93.5%, a difference of 0.030%).
| Demographics | Rating | Rank | 10th Grade |
| Yup'ik | 31.1 /100 | #191 | Fair 93.6% |
| Immigrants | Malaysia | 28.0 /100 | #192 | Fair 93.5% |
| Panamanians | 28.0 /100 | #193 | Fair 93.5% |
| Immigrants | Morocco | 26.9 /100 | #194 | Fair 93.5% |
| Cheyenne | 26.8 /100 | #195 | Fair 93.5% |
| Moroccans | 25.3 /100 | #196 | Fair 93.5% |
| Pueblo | 23.9 /100 | #197 | Fair 93.5% |
| Immigrants | Micronesia | 23.2 /100 | #198 | Fair 93.5% |
| Asians | 23.0 /100 | #199 | Fair 93.5% |
| Hopi | 22.2 /100 | #200 | Fair 93.5% |
| Hawaiians | 21.8 /100 | #201 | Fair 93.5% |
| Immigrants | Uganda | 20.9 /100 | #202 | Fair 93.5% |
| Immigrants | Western Asia | 20.6 /100 | #203 | Fair 93.4% |
| Ute | 20.3 /100 | #204 | Fair 93.4% |
| Immigrants | Indonesia | 20.2 /100 | #205 | Fair 93.4% |