Iranian vs Choctaw 10th Grade
COMPARE
Iranian
Choctaw
10th Grade
10th Grade Comparison
Iranians
Choctaw
95.3%
10TH GRADE
100.0/ 100
METRIC RATING
31st/ 347
METRIC RANK
93.6%
10TH GRADE
36.6/ 100
METRIC RATING
184th/ 347
METRIC RANK
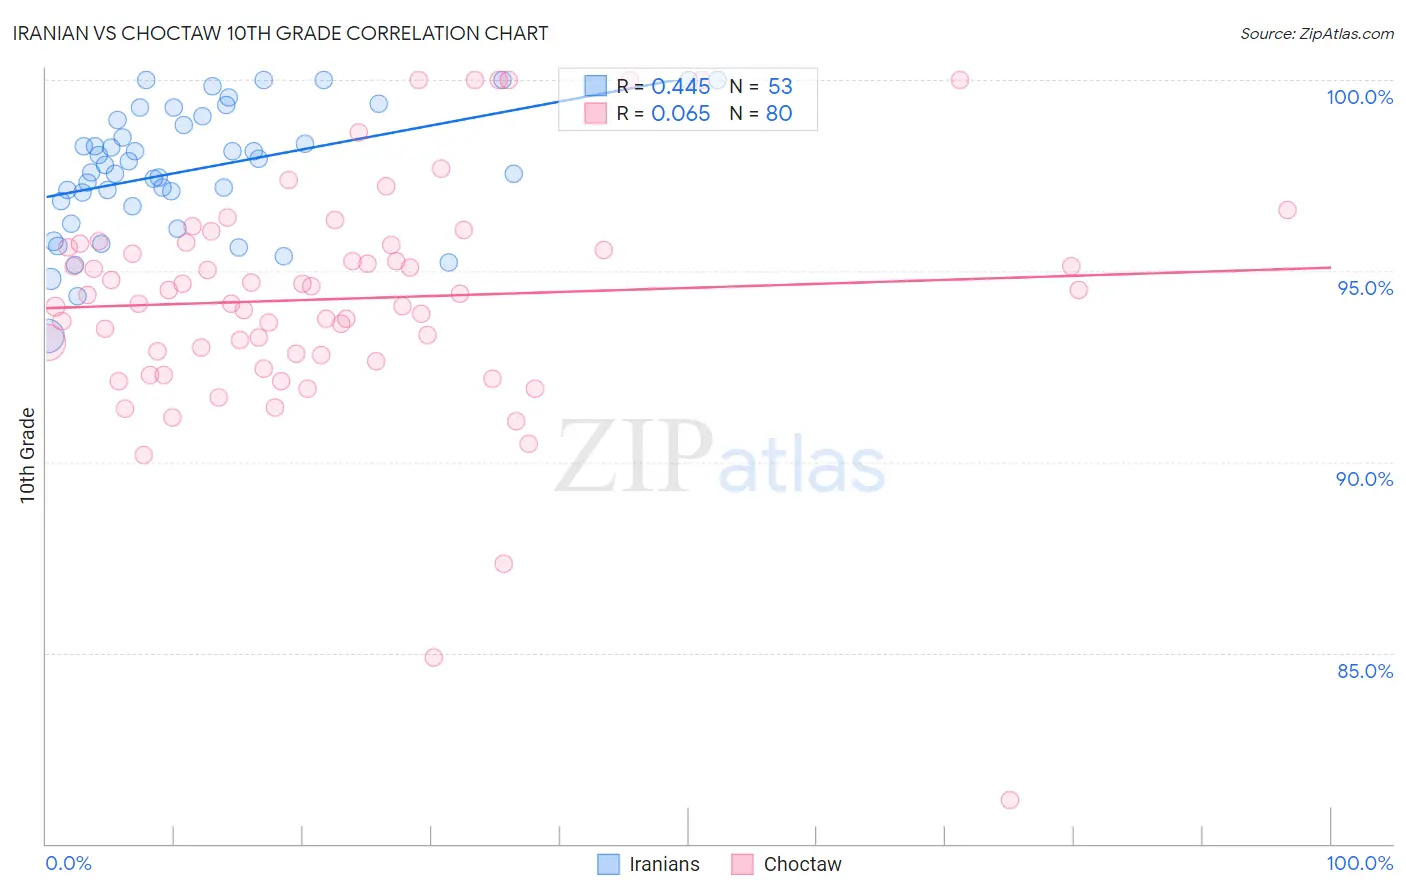
Iranian vs Choctaw 10th Grade Correlation Chart
The statistical analysis conducted on geographies consisting of 310,636,461 people shows a moderate positive correlation between the proportion of Iranians and percentage of population with at least 10th grade education in the United States with a correlation coefficient (R) of 0.445 and weighted average of 95.3%. Similarly, the statistical analysis conducted on geographies consisting of 269,742,499 people shows a slight positive correlation between the proportion of Choctaw and percentage of population with at least 10th grade education in the United States with a correlation coefficient (R) of 0.065 and weighted average of 93.6%, a difference of 1.8%.
10th Grade Correlation Summary
| Measurement | Iranian | Choctaw |
| Minimum | 93.3% | 81.1% |
| Maximum | 100.0% | 100.0% |
| Range | 6.7% | 18.9% |
| Mean | 97.7% | 94.3% |
| Median | 97.8% | 94.4% |
| Interquartile 25% (IQ1) | 96.8% | 92.8% |
| Interquartile 75% (IQ3) | 99.0% | 95.7% |
| Interquartile Range (IQR) | 2.2% | 2.9% |
| Standard Deviation (Sample) | 1.6% | 3.1% |
| Standard Deviation (Population) | 1.6% | 3.1% |
Similar Demographics by 10th Grade
Demographics Similar to Iranians by 10th Grade
In terms of 10th grade, the demographic groups most similar to Iranians are Hungarian (95.3%, a difference of 0.0%), French (95.3%, a difference of 0.0%), British (95.3%, a difference of 0.010%), Belgian (95.4%, a difference of 0.020%), and Estonian (95.3%, a difference of 0.020%).
| Demographics | Rating | Rank | 10th Grade |
| Europeans | 100.0 /100 | #24 | Exceptional 95.5% |
| Maltese | 100.0 /100 | #25 | Exceptional 95.5% |
| Welsh | 100.0 /100 | #26 | Exceptional 95.5% |
| Alaskan Athabascans | 100.0 /100 | #27 | Exceptional 95.4% |
| Luxembourgers | 100.0 /100 | #28 | Exceptional 95.4% |
| Bulgarians | 100.0 /100 | #29 | Exceptional 95.4% |
| Belgians | 100.0 /100 | #30 | Exceptional 95.4% |
| Iranians | 100.0 /100 | #31 | Exceptional 95.3% |
| Hungarians | 100.0 /100 | #32 | Exceptional 95.3% |
| French | 100.0 /100 | #33 | Exceptional 95.3% |
| British | 99.9 /100 | #34 | Exceptional 95.3% |
| Estonians | 99.9 /100 | #35 | Exceptional 95.3% |
| Immigrants | India | 99.9 /100 | #36 | Exceptional 95.3% |
| French Canadians | 99.9 /100 | #37 | Exceptional 95.3% |
| Northern Europeans | 99.9 /100 | #38 | Exceptional 95.3% |
Demographics Similar to Choctaw by 10th Grade
In terms of 10th grade, the demographic groups most similar to Choctaw are Guamanian/Chamorro (93.6%, a difference of 0.0%), Sudanese (93.6%, a difference of 0.0%), Colville (93.6%, a difference of 0.020%), Immigrants from Eastern Asia (93.6%, a difference of 0.020%), and Liberian (93.6%, a difference of 0.020%).
| Demographics | Rating | Rank | 10th Grade |
| Immigrants | Lebanon | 47.1 /100 | #177 | Average 93.7% |
| Sierra Leoneans | 46.1 /100 | #178 | Average 93.7% |
| Paraguayans | 45.3 /100 | #179 | Average 93.7% |
| Blackfeet | 42.8 /100 | #180 | Average 93.7% |
| Immigrants | Northern Africa | 41.6 /100 | #181 | Average 93.7% |
| Colville | 38.8 /100 | #182 | Fair 93.6% |
| Guamanians/Chamorros | 37.1 /100 | #183 | Fair 93.6% |
| Choctaw | 36.6 /100 | #184 | Fair 93.6% |
| Sudanese | 36.6 /100 | #185 | Fair 93.6% |
| Immigrants | Eastern Asia | 35.1 /100 | #186 | Fair 93.6% |
| Liberians | 34.7 /100 | #187 | Fair 93.6% |
| Marshallese | 33.2 /100 | #188 | Fair 93.6% |
| Immigrants | Pakistan | 32.5 /100 | #189 | Fair 93.6% |
| Laotians | 32.1 /100 | #190 | Fair 93.6% |
| Yup'ik | 31.1 /100 | #191 | Fair 93.6% |