Bolivian vs Immigrants from Micronesia 10th Grade
COMPARE
Bolivian
Immigrants from Micronesia
10th Grade
10th Grade Comparison
Bolivians
Immigrants from Micronesia
93.2%
10TH GRADE
6.7/ 100
METRIC RATING
224th/ 347
METRIC RANK
93.5%
10TH GRADE
23.2/ 100
METRIC RATING
198th/ 347
METRIC RANK
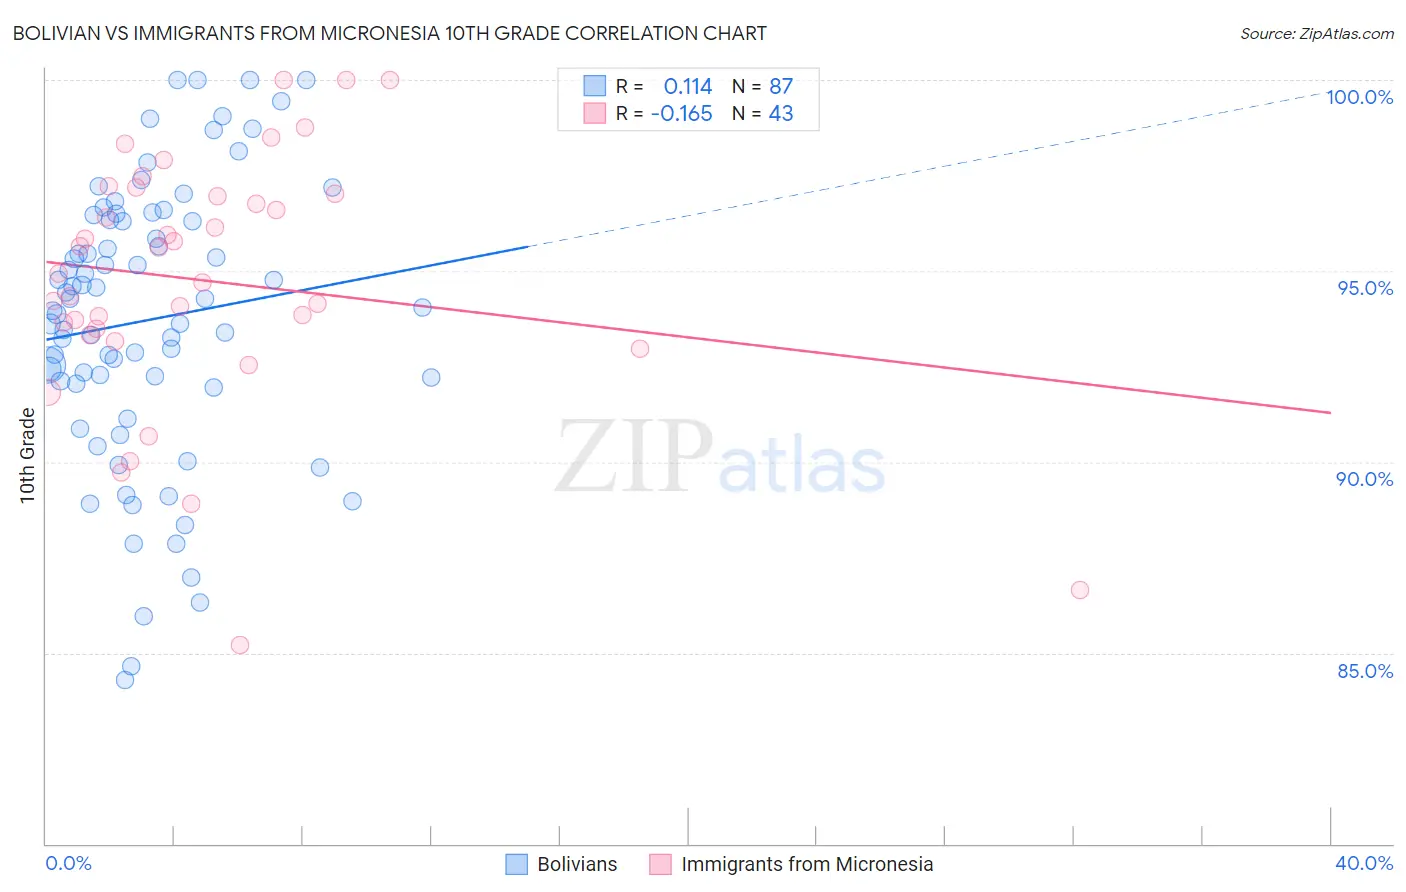
Bolivian vs Immigrants from Micronesia 10th Grade Correlation Chart
The statistical analysis conducted on geographies consisting of 184,666,822 people shows a poor positive correlation between the proportion of Bolivians and percentage of population with at least 10th grade education in the United States with a correlation coefficient (R) of 0.114 and weighted average of 93.2%. Similarly, the statistical analysis conducted on geographies consisting of 61,604,657 people shows a poor negative correlation between the proportion of Immigrants from Micronesia and percentage of population with at least 10th grade education in the United States with a correlation coefficient (R) of -0.165 and weighted average of 93.5%, a difference of 0.32%.
10th Grade Correlation Summary
| Measurement | Bolivian | Immigrants from Micronesia |
| Minimum | 84.3% | 85.2% |
| Maximum | 100.0% | 100.0% |
| Range | 15.7% | 14.8% |
| Mean | 93.7% | 94.7% |
| Median | 94.0% | 94.9% |
| Interquartile 25% (IQ1) | 92.0% | 93.3% |
| Interquartile 75% (IQ3) | 96.3% | 97.0% |
| Interquartile Range (IQR) | 4.3% | 3.7% |
| Standard Deviation (Sample) | 3.6% | 3.3% |
| Standard Deviation (Population) | 3.6% | 3.3% |
Similar Demographics by 10th Grade
Demographics Similar to Bolivians by 10th Grade
In terms of 10th grade, the demographic groups most similar to Bolivians are Somali (93.2%, a difference of 0.020%), Korean (93.2%, a difference of 0.020%), Black/African American (93.2%, a difference of 0.020%), Immigrants from Sierra Leone (93.2%, a difference of 0.030%), and Immigrants from China (93.2%, a difference of 0.030%).
| Demographics | Rating | Rank | 10th Grade |
| Portuguese | 12.1 /100 | #217 | Poor 93.3% |
| Immigrants | Liberia | 10.2 /100 | #218 | Poor 93.3% |
| Seminole | 10.2 /100 | #219 | Poor 93.3% |
| Tongans | 9.5 /100 | #220 | Tragic 93.3% |
| Immigrants | Southern Europe | 8.9 /100 | #221 | Tragic 93.2% |
| Ethiopians | 7.9 /100 | #222 | Tragic 93.2% |
| Immigrants | Sierra Leone | 7.6 /100 | #223 | Tragic 93.2% |
| Bolivians | 6.7 /100 | #224 | Tragic 93.2% |
| Somalis | 6.2 /100 | #225 | Tragic 93.2% |
| Koreans | 6.1 /100 | #226 | Tragic 93.2% |
| Blacks/African Americans | 6.0 /100 | #227 | Tragic 93.2% |
| Immigrants | China | 5.9 /100 | #228 | Tragic 93.2% |
| Immigrants | Ethiopia | 5.1 /100 | #229 | Tragic 93.1% |
| Immigrants | Africa | 5.0 /100 | #230 | Tragic 93.1% |
| South American Indians | 4.9 /100 | #231 | Tragic 93.1% |
Demographics Similar to Immigrants from Micronesia by 10th Grade
In terms of 10th grade, the demographic groups most similar to Immigrants from Micronesia are Asian (93.5%, a difference of 0.0%), Pueblo (93.5%, a difference of 0.010%), Hopi (93.5%, a difference of 0.010%), Hawaiian (93.5%, a difference of 0.020%), and Moroccan (93.5%, a difference of 0.030%).
| Demographics | Rating | Rank | 10th Grade |
| Yup'ik | 31.1 /100 | #191 | Fair 93.6% |
| Immigrants | Malaysia | 28.0 /100 | #192 | Fair 93.5% |
| Panamanians | 28.0 /100 | #193 | Fair 93.5% |
| Immigrants | Morocco | 26.9 /100 | #194 | Fair 93.5% |
| Cheyenne | 26.8 /100 | #195 | Fair 93.5% |
| Moroccans | 25.3 /100 | #196 | Fair 93.5% |
| Pueblo | 23.9 /100 | #197 | Fair 93.5% |
| Immigrants | Micronesia | 23.2 /100 | #198 | Fair 93.5% |
| Asians | 23.0 /100 | #199 | Fair 93.5% |
| Hopi | 22.2 /100 | #200 | Fair 93.5% |
| Hawaiians | 21.8 /100 | #201 | Fair 93.5% |
| Immigrants | Uganda | 20.9 /100 | #202 | Fair 93.5% |
| Immigrants | Western Asia | 20.6 /100 | #203 | Fair 93.4% |
| Ute | 20.3 /100 | #204 | Fair 93.4% |
| Immigrants | Indonesia | 20.2 /100 | #205 | Fair 93.4% |