Immigrants vs Shoshone 11th Grade
COMPARE
Immigrants
Shoshone
11th Grade
11th Grade Comparison
Immigrants
Shoshone
89.7%
11TH GRADE
0.0/ 100
METRIC RATING
303rd/ 347
METRIC RANK
92.5%
11TH GRADE
48.9/ 100
METRIC RATING
175th/ 347
METRIC RANK
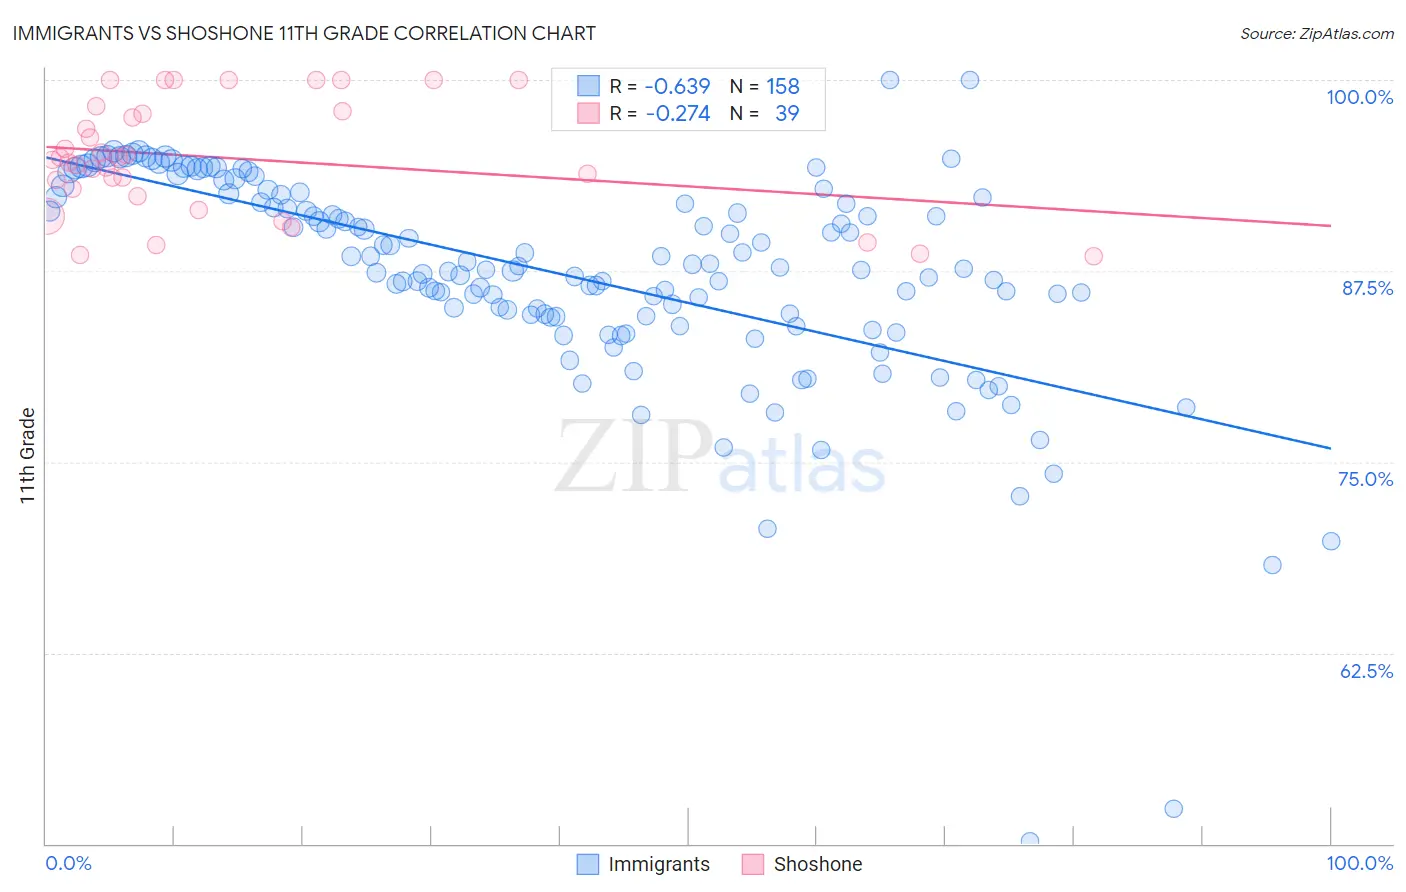
Immigrants vs Shoshone 11th Grade Correlation Chart
The statistical analysis conducted on geographies consisting of 577,785,939 people shows a significant negative correlation between the proportion of Immigrants and percentage of population with at least 11th grade education in the United States with a correlation coefficient (R) of -0.639 and weighted average of 89.7%. Similarly, the statistical analysis conducted on geographies consisting of 66,625,086 people shows a weak negative correlation between the proportion of Shoshone and percentage of population with at least 11th grade education in the United States with a correlation coefficient (R) of -0.274 and weighted average of 92.5%, a difference of 3.1%.
11th Grade Correlation Summary
| Measurement | Immigrants | Shoshone |
| Minimum | 50.2% | 88.5% |
| Maximum | 100.0% | 100.0% |
| Range | 49.8% | 11.5% |
| Mean | 87.3% | 94.9% |
| Median | 87.7% | 94.8% |
| Interquartile 25% (IQ1) | 84.6% | 92.4% |
| Interquartile 75% (IQ3) | 92.3% | 97.9% |
| Interquartile Range (IQR) | 7.8% | 5.5% |
| Standard Deviation (Sample) | 7.1% | 3.7% |
| Standard Deviation (Population) | 7.1% | 3.6% |
Similar Demographics by 11th Grade
Demographics Similar to Immigrants by 11th Grade
In terms of 11th grade, the demographic groups most similar to Immigrants are Yuman (89.7%, a difference of 0.0%), Immigrants from Guyana (89.7%, a difference of 0.010%), Immigrants from Cambodia (89.6%, a difference of 0.080%), Ecuadorian (89.6%, a difference of 0.13%), and Immigrants from Dominica (89.5%, a difference of 0.19%).
| Demographics | Rating | Rank | 11th Grade |
| Fijians | 0.0 /100 | #296 | Tragic 90.0% |
| Navajo | 0.0 /100 | #297 | Tragic 90.0% |
| Immigrants | Fiji | 0.0 /100 | #298 | Tragic 89.9% |
| Japanese | 0.0 /100 | #299 | Tragic 89.9% |
| Immigrants | Haiti | 0.0 /100 | #300 | Tragic 89.9% |
| Guyanese | 0.0 /100 | #301 | Tragic 89.9% |
| Immigrants | Guyana | 0.0 /100 | #302 | Tragic 89.7% |
| Immigrants | Immigrants | 0.0 /100 | #303 | Tragic 89.7% |
| Yuman | 0.0 /100 | #304 | Tragic 89.7% |
| Immigrants | Cambodia | 0.0 /100 | #305 | Tragic 89.6% |
| Ecuadorians | 0.0 /100 | #306 | Tragic 89.6% |
| Immigrants | Dominica | 0.0 /100 | #307 | Tragic 89.5% |
| Nepalese | 0.0 /100 | #308 | Tragic 89.5% |
| Immigrants | Bangladesh | 0.0 /100 | #309 | Tragic 89.5% |
| Yaqui | 0.0 /100 | #310 | Tragic 89.5% |
Demographics Similar to Shoshone by 11th Grade
In terms of 11th grade, the demographic groups most similar to Shoshone are Asian (92.5%, a difference of 0.010%), Spaniard (92.5%, a difference of 0.020%), Immigrants from Pakistan (92.5%, a difference of 0.030%), Indian (Asian) (92.5%, a difference of 0.030%), and Guamanian/Chamorro (92.5%, a difference of 0.040%).
| Demographics | Rating | Rank | 11th Grade |
| Sierra Leoneans | 58.7 /100 | #168 | Average 92.6% |
| Immigrants | Albania | 57.8 /100 | #169 | Average 92.6% |
| Immigrants | Northern Africa | 57.3 /100 | #170 | Average 92.6% |
| Laotians | 54.4 /100 | #171 | Average 92.6% |
| Immigrants | Pakistan | 52.3 /100 | #172 | Average 92.5% |
| Indians (Asian) | 51.5 /100 | #173 | Average 92.5% |
| Asians | 50.0 /100 | #174 | Average 92.5% |
| Shoshone | 48.9 /100 | #175 | Average 92.5% |
| Spaniards | 46.9 /100 | #176 | Average 92.5% |
| Guamanians/Chamorros | 45.0 /100 | #177 | Average 92.5% |
| Sudanese | 43.4 /100 | #178 | Average 92.5% |
| Creek | 40.9 /100 | #179 | Average 92.4% |
| Inupiat | 40.7 /100 | #180 | Average 92.4% |
| Cherokee | 40.7 /100 | #181 | Average 92.4% |
| Immigrants | Morocco | 38.6 /100 | #182 | Fair 92.4% |