Hispanic or Latino vs Shoshone 11th Grade
COMPARE
Hispanic or Latino
Shoshone
11th Grade
11th Grade Comparison
Hispanics or Latinos
Shoshone
87.3%
11TH GRADE
0.0/ 100
METRIC RATING
331st/ 347
METRIC RANK
92.5%
11TH GRADE
48.9/ 100
METRIC RATING
175th/ 347
METRIC RANK
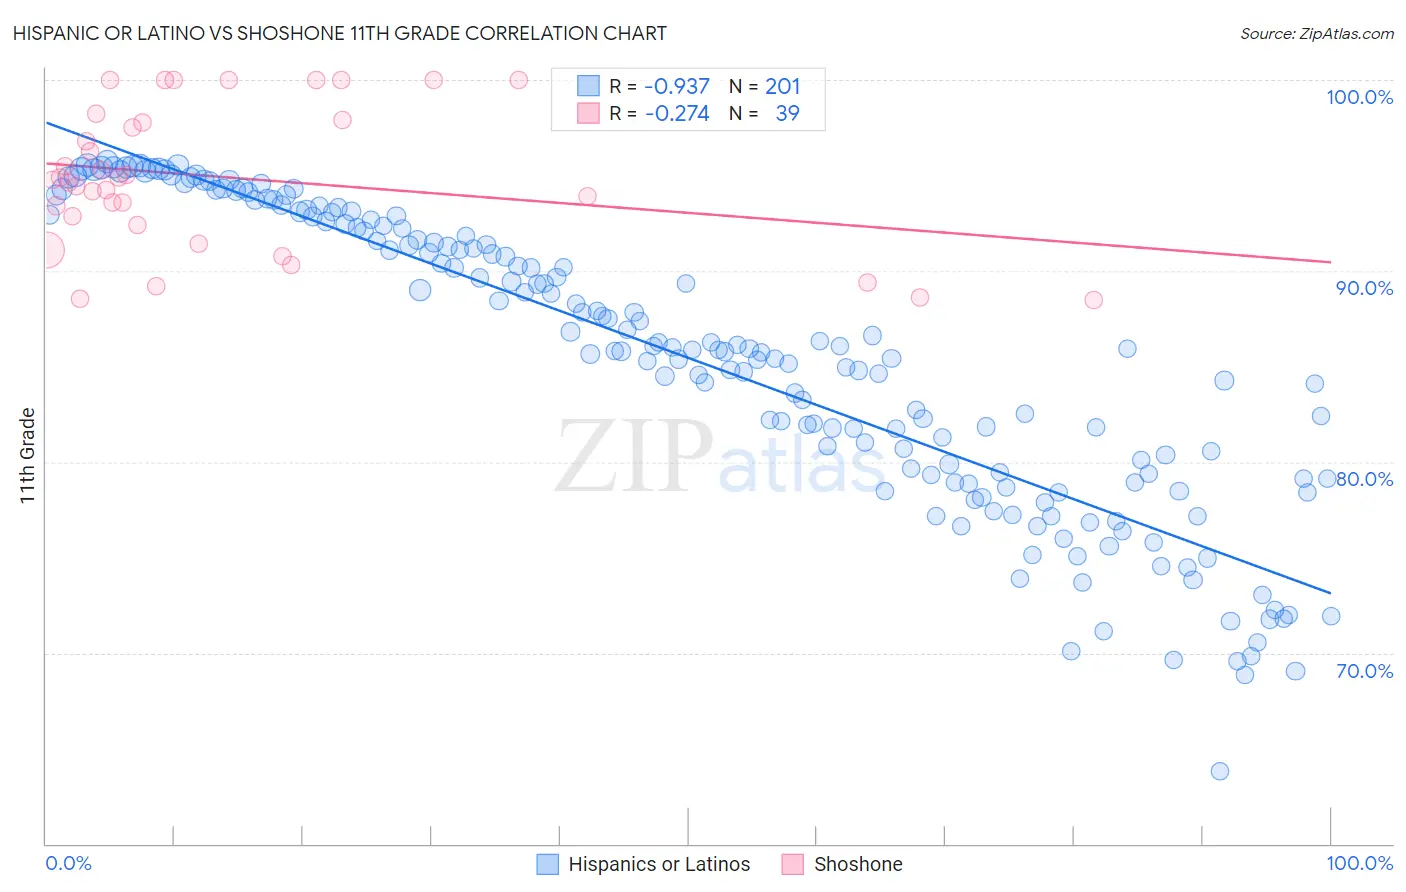
Hispanic or Latino vs Shoshone 11th Grade Correlation Chart
The statistical analysis conducted on geographies consisting of 578,613,877 people shows a near-perfect negative correlation between the proportion of Hispanics or Latinos and percentage of population with at least 11th grade education in the United States with a correlation coefficient (R) of -0.937 and weighted average of 87.3%. Similarly, the statistical analysis conducted on geographies consisting of 66,625,086 people shows a weak negative correlation between the proportion of Shoshone and percentage of population with at least 11th grade education in the United States with a correlation coefficient (R) of -0.274 and weighted average of 92.5%, a difference of 6.0%.
11th Grade Correlation Summary
| Measurement | Hispanic or Latino | Shoshone |
| Minimum | 63.8% | 88.5% |
| Maximum | 95.7% | 100.0% |
| Range | 31.9% | 11.5% |
| Mean | 85.4% | 94.9% |
| Median | 85.9% | 94.8% |
| Interquartile 25% (IQ1) | 79.2% | 92.4% |
| Interquartile 75% (IQ3) | 92.4% | 97.9% |
| Interquartile Range (IQR) | 13.2% | 5.5% |
| Standard Deviation (Sample) | 7.7% | 3.7% |
| Standard Deviation (Population) | 7.6% | 3.6% |
Similar Demographics by 11th Grade
Demographics Similar to Hispanics or Latinos by 11th Grade
In terms of 11th grade, the demographic groups most similar to Hispanics or Latinos are Honduran (87.4%, a difference of 0.060%), Immigrants from the Azores (87.2%, a difference of 0.090%), Mexican American Indian (87.5%, a difference of 0.25%), Immigrants from Yemen (87.1%, a difference of 0.26%), and Tohono O'odham (87.6%, a difference of 0.32%).
| Demographics | Rating | Rank | 11th Grade |
| Central American Indians | 0.0 /100 | #324 | Tragic 88.2% |
| Immigrants | Nicaragua | 0.0 /100 | #325 | Tragic 88.1% |
| Dominicans | 0.0 /100 | #326 | Tragic 87.7% |
| Immigrants | Cabo Verde | 0.0 /100 | #327 | Tragic 87.6% |
| Tohono O'odham | 0.0 /100 | #328 | Tragic 87.6% |
| Mexican American Indians | 0.0 /100 | #329 | Tragic 87.5% |
| Hondurans | 0.0 /100 | #330 | Tragic 87.4% |
| Hispanics or Latinos | 0.0 /100 | #331 | Tragic 87.3% |
| Immigrants | Azores | 0.0 /100 | #332 | Tragic 87.2% |
| Immigrants | Yemen | 0.0 /100 | #333 | Tragic 87.1% |
| Houma | 0.0 /100 | #334 | Tragic 87.0% |
| Central Americans | 0.0 /100 | #335 | Tragic 86.9% |
| Immigrants | Dominican Republic | 0.0 /100 | #336 | Tragic 86.9% |
| Immigrants | Honduras | 0.0 /100 | #337 | Tragic 86.9% |
| Immigrants | Latin America | 0.0 /100 | #338 | Tragic 86.8% |
Demographics Similar to Shoshone by 11th Grade
In terms of 11th grade, the demographic groups most similar to Shoshone are Asian (92.5%, a difference of 0.010%), Spaniard (92.5%, a difference of 0.020%), Immigrants from Pakistan (92.5%, a difference of 0.030%), Indian (Asian) (92.5%, a difference of 0.030%), and Guamanian/Chamorro (92.5%, a difference of 0.040%).
| Demographics | Rating | Rank | 11th Grade |
| Sierra Leoneans | 58.7 /100 | #168 | Average 92.6% |
| Immigrants | Albania | 57.8 /100 | #169 | Average 92.6% |
| Immigrants | Northern Africa | 57.3 /100 | #170 | Average 92.6% |
| Laotians | 54.4 /100 | #171 | Average 92.6% |
| Immigrants | Pakistan | 52.3 /100 | #172 | Average 92.5% |
| Indians (Asian) | 51.5 /100 | #173 | Average 92.5% |
| Asians | 50.0 /100 | #174 | Average 92.5% |
| Shoshone | 48.9 /100 | #175 | Average 92.5% |
| Spaniards | 46.9 /100 | #176 | Average 92.5% |
| Guamanians/Chamorros | 45.0 /100 | #177 | Average 92.5% |
| Sudanese | 43.4 /100 | #178 | Average 92.5% |
| Creek | 40.9 /100 | #179 | Average 92.4% |
| Inupiat | 40.7 /100 | #180 | Average 92.4% |
| Cherokee | 40.7 /100 | #181 | Average 92.4% |
| Immigrants | Morocco | 38.6 /100 | #182 | Fair 92.4% |