Immigrants vs Fijian 11th Grade
COMPARE
Immigrants
Fijian
11th Grade
11th Grade Comparison
Immigrants
Fijians
89.7%
11TH GRADE
0.0/ 100
METRIC RATING
303rd/ 347
METRIC RANK
90.0%
11TH GRADE
0.0/ 100
METRIC RATING
296th/ 347
METRIC RANK
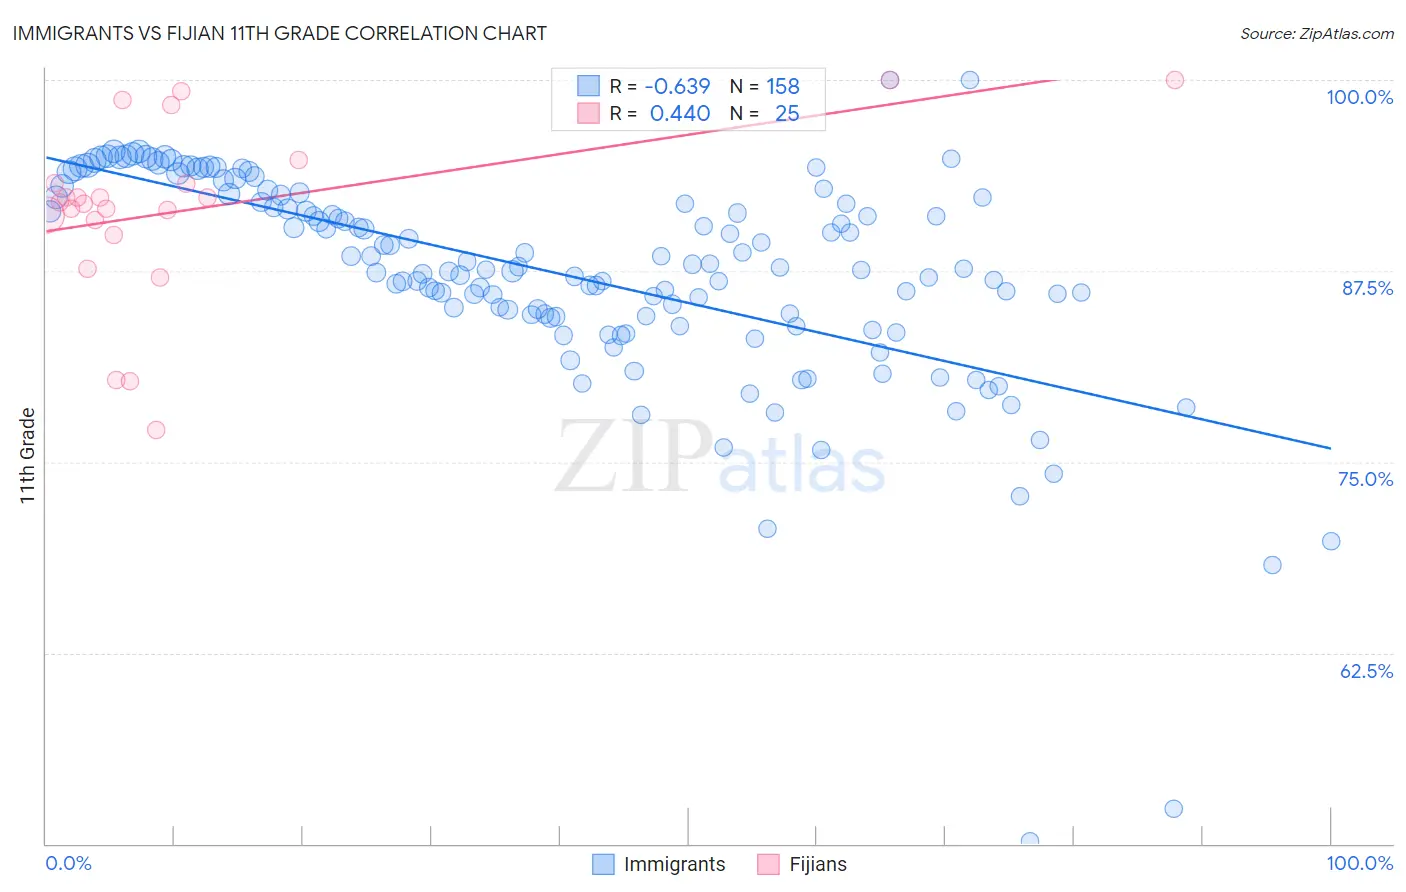
Immigrants vs Fijian 11th Grade Correlation Chart
The statistical analysis conducted on geographies consisting of 577,785,939 people shows a significant negative correlation between the proportion of Immigrants and percentage of population with at least 11th grade education in the United States with a correlation coefficient (R) of -0.639 and weighted average of 89.7%. Similarly, the statistical analysis conducted on geographies consisting of 55,948,842 people shows a moderate positive correlation between the proportion of Fijians and percentage of population with at least 11th grade education in the United States with a correlation coefficient (R) of 0.440 and weighted average of 90.0%, a difference of 0.36%.
11th Grade Correlation Summary
| Measurement | Immigrants | Fijian |
| Minimum | 50.2% | 77.1% |
| Maximum | 100.0% | 100.0% |
| Range | 49.8% | 22.9% |
| Mean | 87.3% | 91.6% |
| Median | 87.7% | 92.0% |
| Interquartile 25% (IQ1) | 84.6% | 90.4% |
| Interquartile 75% (IQ3) | 92.3% | 94.0% |
| Interquartile Range (IQR) | 7.8% | 3.6% |
| Standard Deviation (Sample) | 7.1% | 5.8% |
| Standard Deviation (Population) | 7.1% | 5.7% |
Demographics Similar to Immigrants and Fijians by 11th Grade
In terms of 11th grade, the demographic groups most similar to Immigrants are Yuman (89.7%, a difference of 0.0%), Immigrants from Guyana (89.7%, a difference of 0.010%), Immigrants from Cambodia (89.6%, a difference of 0.080%), Ecuadorian (89.6%, a difference of 0.13%), and Immigrants from Dominica (89.5%, a difference of 0.19%). Similarly, the demographic groups most similar to Fijians are Immigrants from Vietnam (90.0%, a difference of 0.020%), Navajo (90.0%, a difference of 0.040%), Immigrants from Fiji (89.9%, a difference of 0.11%), Immigrants from Grenada (90.1%, a difference of 0.12%), and Japanese (89.9%, a difference of 0.14%).
| Demographics | Rating | Rank | 11th Grade |
| British West Indians | 0.0 /100 | #289 | Tragic 90.3% |
| Indonesians | 0.0 /100 | #290 | Tragic 90.3% |
| Haitians | 0.0 /100 | #291 | Tragic 90.3% |
| Cubans | 0.0 /100 | #292 | Tragic 90.2% |
| Natives/Alaskans | 0.0 /100 | #293 | Tragic 90.2% |
| Immigrants | Grenada | 0.0 /100 | #294 | Tragic 90.1% |
| Immigrants | Vietnam | 0.0 /100 | #295 | Tragic 90.0% |
| Fijians | 0.0 /100 | #296 | Tragic 90.0% |
| Navajo | 0.0 /100 | #297 | Tragic 90.0% |
| Immigrants | Fiji | 0.0 /100 | #298 | Tragic 89.9% |
| Japanese | 0.0 /100 | #299 | Tragic 89.9% |
| Immigrants | Haiti | 0.0 /100 | #300 | Tragic 89.9% |
| Guyanese | 0.0 /100 | #301 | Tragic 89.9% |
| Immigrants | Guyana | 0.0 /100 | #302 | Tragic 89.7% |
| Immigrants | Immigrants | 0.0 /100 | #303 | Tragic 89.7% |
| Yuman | 0.0 /100 | #304 | Tragic 89.7% |
| Immigrants | Cambodia | 0.0 /100 | #305 | Tragic 89.6% |
| Ecuadorians | 0.0 /100 | #306 | Tragic 89.6% |
| Immigrants | Dominica | 0.0 /100 | #307 | Tragic 89.5% |
| Nepalese | 0.0 /100 | #308 | Tragic 89.5% |
| Immigrants | Bangladesh | 0.0 /100 | #309 | Tragic 89.5% |