Russian vs Shoshone 11th Grade
COMPARE
Russian
Shoshone
11th Grade
11th Grade Comparison
Russians
Shoshone
94.3%
11TH GRADE
100.0/ 100
METRIC RATING
30th/ 347
METRIC RANK
92.5%
11TH GRADE
48.9/ 100
METRIC RATING
175th/ 347
METRIC RANK
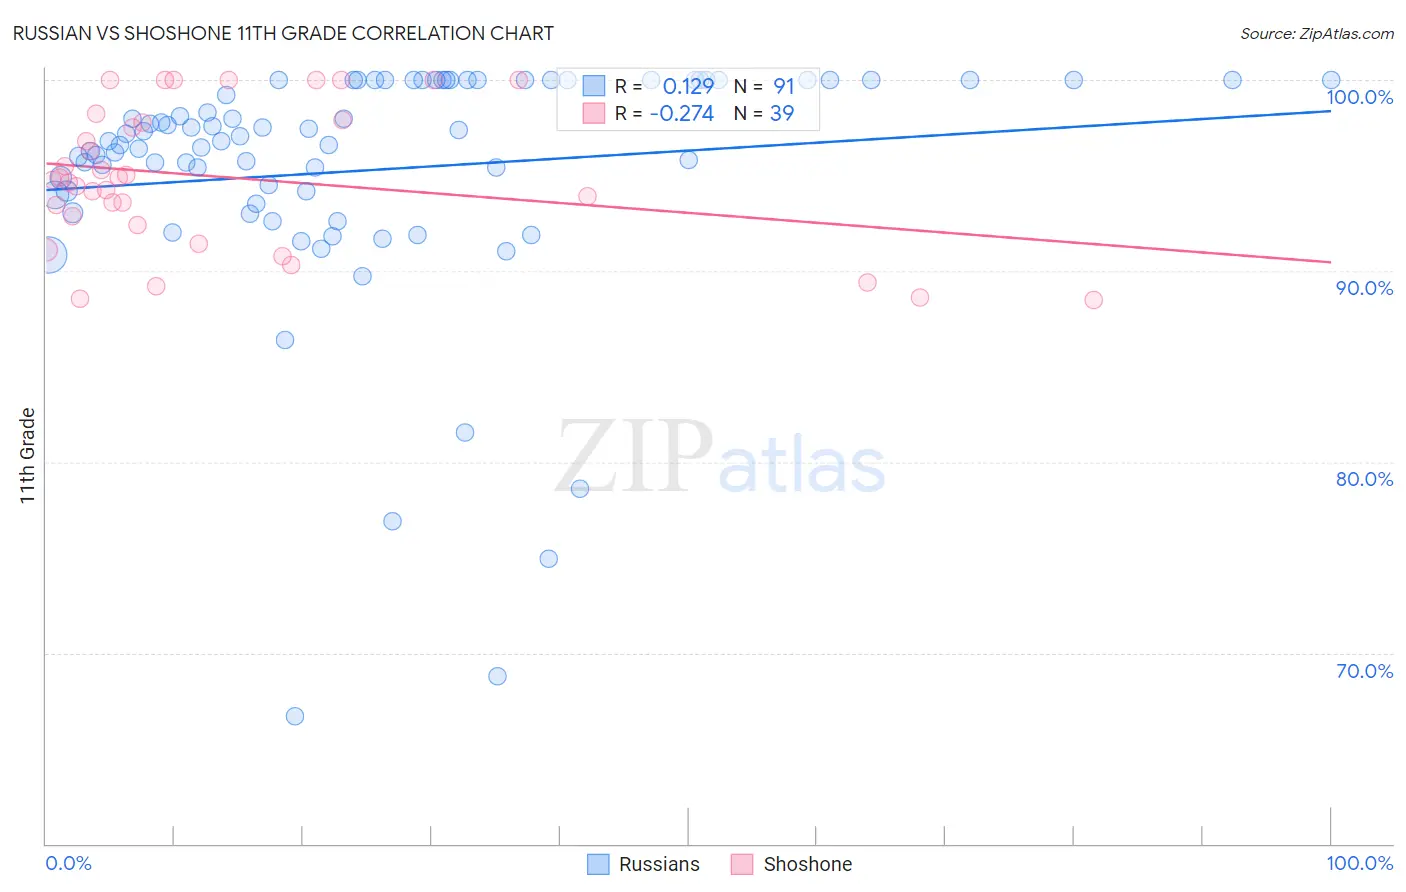
Russian vs Shoshone 11th Grade Correlation Chart
The statistical analysis conducted on geographies consisting of 512,259,122 people shows a poor positive correlation between the proportion of Russians and percentage of population with at least 11th grade education in the United States with a correlation coefficient (R) of 0.129 and weighted average of 94.3%. Similarly, the statistical analysis conducted on geographies consisting of 66,625,086 people shows a weak negative correlation between the proportion of Shoshone and percentage of population with at least 11th grade education in the United States with a correlation coefficient (R) of -0.274 and weighted average of 92.5%, a difference of 1.9%.
11th Grade Correlation Summary
| Measurement | Russian | Shoshone |
| Minimum | 66.7% | 88.5% |
| Maximum | 100.0% | 100.0% |
| Range | 33.3% | 11.5% |
| Mean | 95.3% | 94.9% |
| Median | 96.8% | 94.8% |
| Interquartile 25% (IQ1) | 94.0% | 92.4% |
| Interquartile 75% (IQ3) | 100.0% | 97.9% |
| Interquartile Range (IQR) | 6.0% | 5.5% |
| Standard Deviation (Sample) | 6.5% | 3.7% |
| Standard Deviation (Population) | 6.4% | 3.6% |
Similar Demographics by 11th Grade
Demographics Similar to Russians by 11th Grade
In terms of 11th grade, the demographic groups most similar to Russians are Welsh (94.2%, a difference of 0.020%), Belgian (94.2%, a difference of 0.020%), British (94.2%, a difference of 0.050%), Immigrants from Scotland (94.2%, a difference of 0.060%), and Immigrants from Singapore (94.2%, a difference of 0.060%).
| Demographics | Rating | Rank | 11th Grade |
| Czechs | 100.0 /100 | #23 | Exceptional 94.4% |
| English | 100.0 /100 | #24 | Exceptional 94.4% |
| Irish | 100.0 /100 | #25 | Exceptional 94.4% |
| Scottish | 100.0 /100 | #26 | Exceptional 94.4% |
| Europeans | 100.0 /100 | #27 | Exceptional 94.4% |
| Estonians | 100.0 /100 | #28 | Exceptional 94.4% |
| Dutch | 100.0 /100 | #29 | Exceptional 94.3% |
| Russians | 100.0 /100 | #30 | Exceptional 94.3% |
| Welsh | 99.9 /100 | #31 | Exceptional 94.2% |
| Belgians | 99.9 /100 | #32 | Exceptional 94.2% |
| British | 99.9 /100 | #33 | Exceptional 94.2% |
| Immigrants | Scotland | 99.9 /100 | #34 | Exceptional 94.2% |
| Immigrants | Singapore | 99.9 /100 | #35 | Exceptional 94.2% |
| Immigrants | Northern Europe | 99.9 /100 | #36 | Exceptional 94.2% |
| Northern Europeans | 99.9 /100 | #37 | Exceptional 94.2% |
Demographics Similar to Shoshone by 11th Grade
In terms of 11th grade, the demographic groups most similar to Shoshone are Asian (92.5%, a difference of 0.010%), Spaniard (92.5%, a difference of 0.020%), Immigrants from Pakistan (92.5%, a difference of 0.030%), Indian (Asian) (92.5%, a difference of 0.030%), and Guamanian/Chamorro (92.5%, a difference of 0.040%).
| Demographics | Rating | Rank | 11th Grade |
| Sierra Leoneans | 58.7 /100 | #168 | Average 92.6% |
| Immigrants | Albania | 57.8 /100 | #169 | Average 92.6% |
| Immigrants | Northern Africa | 57.3 /100 | #170 | Average 92.6% |
| Laotians | 54.4 /100 | #171 | Average 92.6% |
| Immigrants | Pakistan | 52.3 /100 | #172 | Average 92.5% |
| Indians (Asian) | 51.5 /100 | #173 | Average 92.5% |
| Asians | 50.0 /100 | #174 | Average 92.5% |
| Shoshone | 48.9 /100 | #175 | Average 92.5% |
| Spaniards | 46.9 /100 | #176 | Average 92.5% |
| Guamanians/Chamorros | 45.0 /100 | #177 | Average 92.5% |
| Sudanese | 43.4 /100 | #178 | Average 92.5% |
| Creek | 40.9 /100 | #179 | Average 92.4% |
| Inupiat | 40.7 /100 | #180 | Average 92.4% |
| Cherokee | 40.7 /100 | #181 | Average 92.4% |
| Immigrants | Morocco | 38.6 /100 | #182 | Fair 92.4% |