Immigrants vs Immigrants from Greece 11th Grade
COMPARE
Immigrants
Immigrants from Greece
11th Grade
11th Grade Comparison
Immigrants
Immigrants from Greece
89.7%
11TH GRADE
0.0/ 100
METRIC RATING
303rd/ 347
METRIC RANK
93.2%
11TH GRADE
95.9/ 100
METRIC RATING
123rd/ 347
METRIC RANK
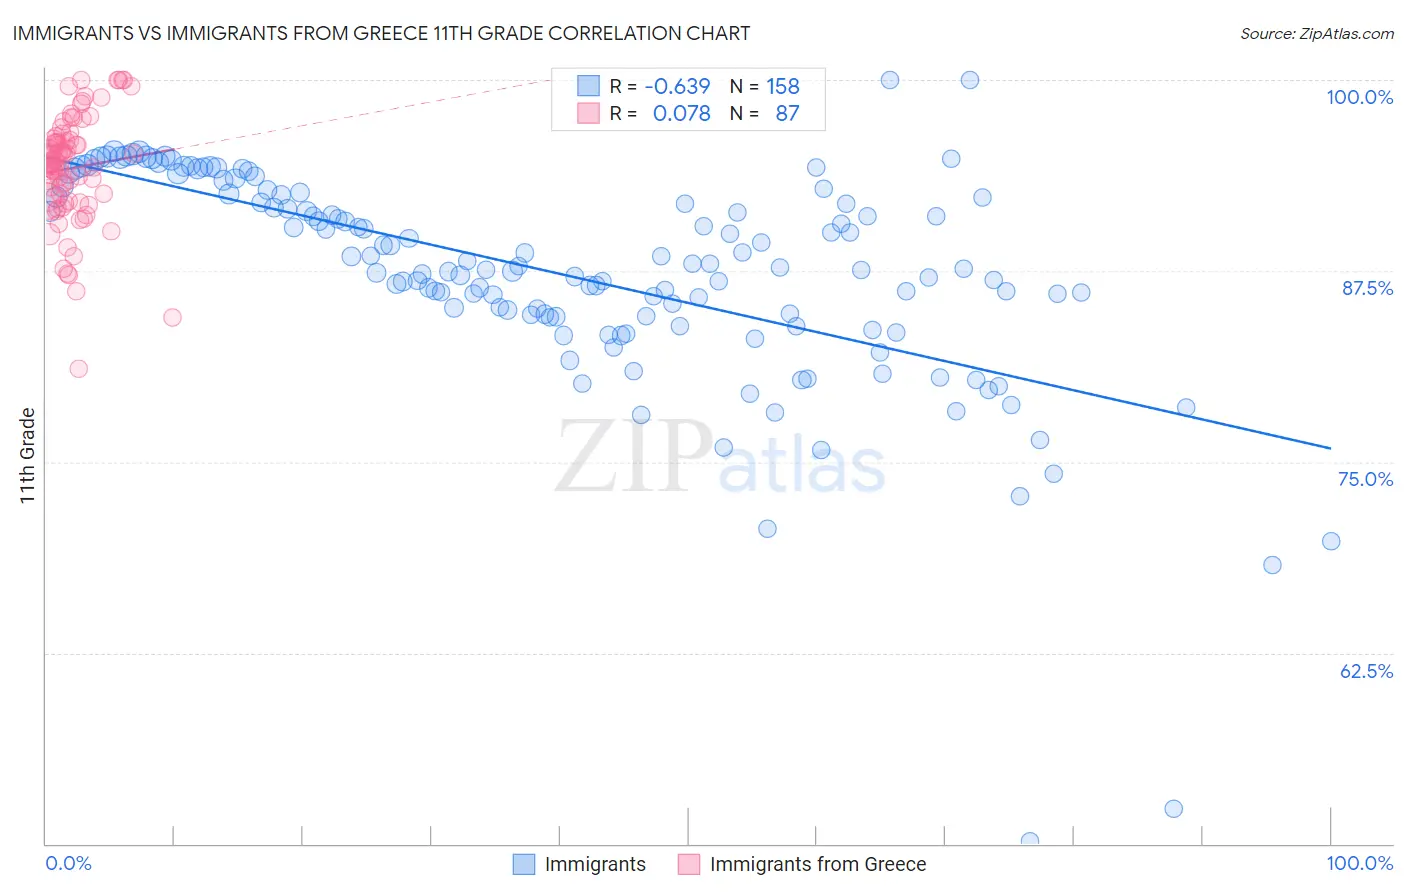
Immigrants vs Immigrants from Greece 11th Grade Correlation Chart
The statistical analysis conducted on geographies consisting of 577,785,939 people shows a significant negative correlation between the proportion of Immigrants and percentage of population with at least 11th grade education in the United States with a correlation coefficient (R) of -0.639 and weighted average of 89.7%. Similarly, the statistical analysis conducted on geographies consisting of 216,879,847 people shows a slight positive correlation between the proportion of Immigrants from Greece and percentage of population with at least 11th grade education in the United States with a correlation coefficient (R) of 0.078 and weighted average of 93.2%, a difference of 3.9%.
11th Grade Correlation Summary
| Measurement | Immigrants | Immigrants from Greece |
| Minimum | 50.2% | 81.1% |
| Maximum | 100.0% | 100.0% |
| Range | 49.8% | 18.9% |
| Mean | 87.3% | 94.2% |
| Median | 87.7% | 94.6% |
| Interquartile 25% (IQ1) | 84.6% | 92.1% |
| Interquartile 75% (IQ3) | 92.3% | 96.1% |
| Interquartile Range (IQR) | 7.8% | 4.0% |
| Standard Deviation (Sample) | 7.1% | 3.6% |
| Standard Deviation (Population) | 7.1% | 3.6% |
Similar Demographics by 11th Grade
Demographics Similar to Immigrants by 11th Grade
In terms of 11th grade, the demographic groups most similar to Immigrants are Yuman (89.7%, a difference of 0.0%), Immigrants from Guyana (89.7%, a difference of 0.010%), Immigrants from Cambodia (89.6%, a difference of 0.080%), Ecuadorian (89.6%, a difference of 0.13%), and Immigrants from Dominica (89.5%, a difference of 0.19%).
| Demographics | Rating | Rank | 11th Grade |
| Fijians | 0.0 /100 | #296 | Tragic 90.0% |
| Navajo | 0.0 /100 | #297 | Tragic 90.0% |
| Immigrants | Fiji | 0.0 /100 | #298 | Tragic 89.9% |
| Japanese | 0.0 /100 | #299 | Tragic 89.9% |
| Immigrants | Haiti | 0.0 /100 | #300 | Tragic 89.9% |
| Guyanese | 0.0 /100 | #301 | Tragic 89.9% |
| Immigrants | Guyana | 0.0 /100 | #302 | Tragic 89.7% |
| Immigrants | Immigrants | 0.0 /100 | #303 | Tragic 89.7% |
| Yuman | 0.0 /100 | #304 | Tragic 89.7% |
| Immigrants | Cambodia | 0.0 /100 | #305 | Tragic 89.6% |
| Ecuadorians | 0.0 /100 | #306 | Tragic 89.6% |
| Immigrants | Dominica | 0.0 /100 | #307 | Tragic 89.5% |
| Nepalese | 0.0 /100 | #308 | Tragic 89.5% |
| Immigrants | Bangladesh | 0.0 /100 | #309 | Tragic 89.5% |
| Yaqui | 0.0 /100 | #310 | Tragic 89.5% |
Demographics Similar to Immigrants from Greece by 11th Grade
In terms of 11th grade, the demographic groups most similar to Immigrants from Greece are Immigrants from Eastern Europe (93.2%, a difference of 0.0%), Immigrants from Sri Lanka (93.2%, a difference of 0.020%), German Russian (93.3%, a difference of 0.030%), Immigrants from Belarus (93.3%, a difference of 0.030%), and Basque (93.2%, a difference of 0.040%).
| Demographics | Rating | Rank | 11th Grade |
| Immigrants | Hungary | 97.5 /100 | #116 | Exceptional 93.4% |
| Whites/Caucasians | 97.4 /100 | #117 | Exceptional 93.3% |
| Immigrants | Korea | 97.0 /100 | #118 | Exceptional 93.3% |
| Israelis | 97.0 /100 | #119 | Exceptional 93.3% |
| Immigrants | Russia | 96.6 /100 | #120 | Exceptional 93.3% |
| German Russians | 96.4 /100 | #121 | Exceptional 93.3% |
| Immigrants | Belarus | 96.3 /100 | #122 | Exceptional 93.3% |
| Immigrants | Greece | 95.9 /100 | #123 | Exceptional 93.2% |
| Immigrants | Eastern Europe | 95.9 /100 | #124 | Exceptional 93.2% |
| Immigrants | Sri Lanka | 95.6 /100 | #125 | Exceptional 93.2% |
| Basques | 95.2 /100 | #126 | Exceptional 93.2% |
| Immigrants | Kazakhstan | 92.4 /100 | #127 | Exceptional 93.1% |
| Immigrants | Jordan | 92.4 /100 | #128 | Exceptional 93.1% |
| Immigrants | Ukraine | 89.8 /100 | #129 | Excellent 93.0% |
| Albanians | 89.5 /100 | #130 | Excellent 93.0% |