Immigrants vs Chickasaw 11th Grade
COMPARE
Immigrants
Chickasaw
11th Grade
11th Grade Comparison
Immigrants
Chickasaw
89.7%
11TH GRADE
0.0/ 100
METRIC RATING
303rd/ 347
METRIC RANK
92.3%
11TH GRADE
31.4/ 100
METRIC RATING
190th/ 347
METRIC RANK
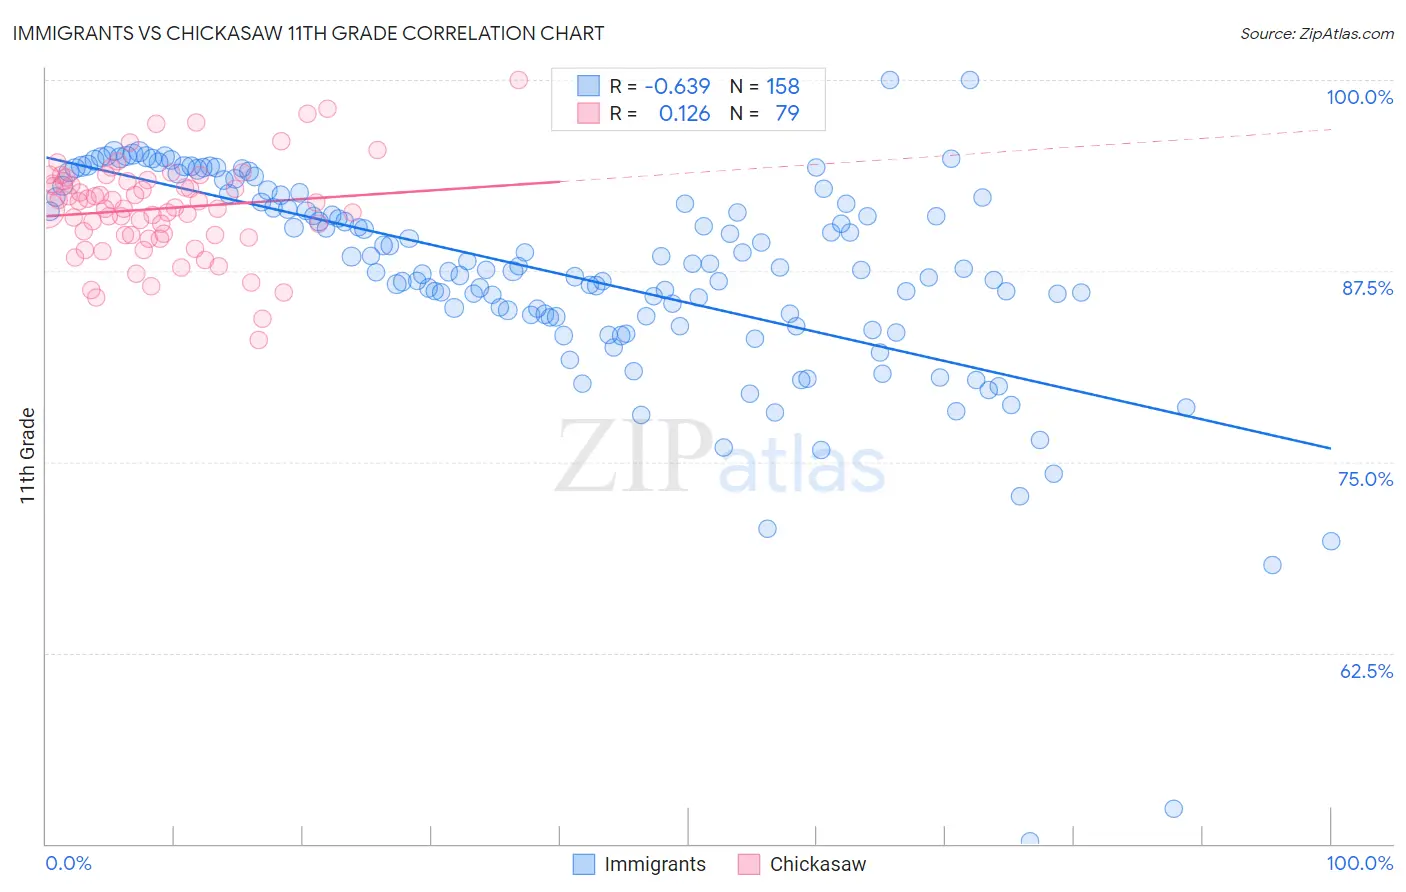
Immigrants vs Chickasaw 11th Grade Correlation Chart
The statistical analysis conducted on geographies consisting of 577,785,939 people shows a significant negative correlation between the proportion of Immigrants and percentage of population with at least 11th grade education in the United States with a correlation coefficient (R) of -0.639 and weighted average of 89.7%. Similarly, the statistical analysis conducted on geographies consisting of 147,726,791 people shows a poor positive correlation between the proportion of Chickasaw and percentage of population with at least 11th grade education in the United States with a correlation coefficient (R) of 0.126 and weighted average of 92.3%, a difference of 2.9%.
11th Grade Correlation Summary
| Measurement | Immigrants | Chickasaw |
| Minimum | 50.2% | 83.0% |
| Maximum | 100.0% | 100.0% |
| Range | 49.8% | 17.0% |
| Mean | 87.3% | 91.6% |
| Median | 87.7% | 91.6% |
| Interquartile 25% (IQ1) | 84.6% | 89.8% |
| Interquartile 75% (IQ3) | 92.3% | 93.4% |
| Interquartile Range (IQR) | 7.8% | 3.5% |
| Standard Deviation (Sample) | 7.1% | 3.1% |
| Standard Deviation (Population) | 7.1% | 3.1% |
Similar Demographics by 11th Grade
Demographics Similar to Immigrants by 11th Grade
In terms of 11th grade, the demographic groups most similar to Immigrants are Yuman (89.7%, a difference of 0.0%), Immigrants from Guyana (89.7%, a difference of 0.010%), Immigrants from Cambodia (89.6%, a difference of 0.080%), Ecuadorian (89.6%, a difference of 0.13%), and Immigrants from Dominica (89.5%, a difference of 0.19%).
| Demographics | Rating | Rank | 11th Grade |
| Fijians | 0.0 /100 | #296 | Tragic 90.0% |
| Navajo | 0.0 /100 | #297 | Tragic 90.0% |
| Immigrants | Fiji | 0.0 /100 | #298 | Tragic 89.9% |
| Japanese | 0.0 /100 | #299 | Tragic 89.9% |
| Immigrants | Haiti | 0.0 /100 | #300 | Tragic 89.9% |
| Guyanese | 0.0 /100 | #301 | Tragic 89.9% |
| Immigrants | Guyana | 0.0 /100 | #302 | Tragic 89.7% |
| Immigrants | Immigrants | 0.0 /100 | #303 | Tragic 89.7% |
| Yuman | 0.0 /100 | #304 | Tragic 89.7% |
| Immigrants | Cambodia | 0.0 /100 | #305 | Tragic 89.6% |
| Ecuadorians | 0.0 /100 | #306 | Tragic 89.6% |
| Immigrants | Dominica | 0.0 /100 | #307 | Tragic 89.5% |
| Nepalese | 0.0 /100 | #308 | Tragic 89.5% |
| Immigrants | Bangladesh | 0.0 /100 | #309 | Tragic 89.5% |
| Yaqui | 0.0 /100 | #310 | Tragic 89.5% |
Demographics Similar to Chickasaw by 11th Grade
In terms of 11th grade, the demographic groups most similar to Chickasaw are French American Indian (92.3%, a difference of 0.010%), Immigrants from Syria (92.3%, a difference of 0.010%), Immigrants from Chile (92.4%, a difference of 0.020%), Immigrants from Indonesia (92.4%, a difference of 0.030%), and Moroccan (92.3%, a difference of 0.030%).
| Demographics | Rating | Rank | 11th Grade |
| Immigrants | Malaysia | 37.6 /100 | #183 | Fair 92.4% |
| Immigrants | Asia | 37.4 /100 | #184 | Fair 92.4% |
| Immigrants | Nepal | 36.4 /100 | #185 | Fair 92.4% |
| Arapaho | 35.1 /100 | #186 | Fair 92.4% |
| Immigrants | Western Asia | 35.0 /100 | #187 | Fair 92.4% |
| Immigrants | Indonesia | 33.7 /100 | #188 | Fair 92.4% |
| Immigrants | Chile | 33.3 /100 | #189 | Fair 92.4% |
| Chickasaw | 31.4 /100 | #190 | Fair 92.3% |
| French American Indians | 30.8 /100 | #191 | Fair 92.3% |
| Immigrants | Syria | 30.4 /100 | #192 | Fair 92.3% |
| Moroccans | 28.7 /100 | #193 | Fair 92.3% |
| Sioux | 28.5 /100 | #194 | Fair 92.3% |
| Liberians | 26.8 /100 | #195 | Fair 92.3% |
| Panamanians | 26.4 /100 | #196 | Fair 92.3% |
| Marshallese | 26.0 /100 | #197 | Fair 92.3% |