Immigrants vs Immigrants from Lithuania 11th Grade
COMPARE
Immigrants
Immigrants from Lithuania
11th Grade
11th Grade Comparison
Immigrants
Immigrants from Lithuania
89.7%
11TH GRADE
0.0/ 100
METRIC RATING
303rd/ 347
METRIC RANK
94.1%
11TH GRADE
99.9/ 100
METRIC RATING
39th/ 347
METRIC RANK
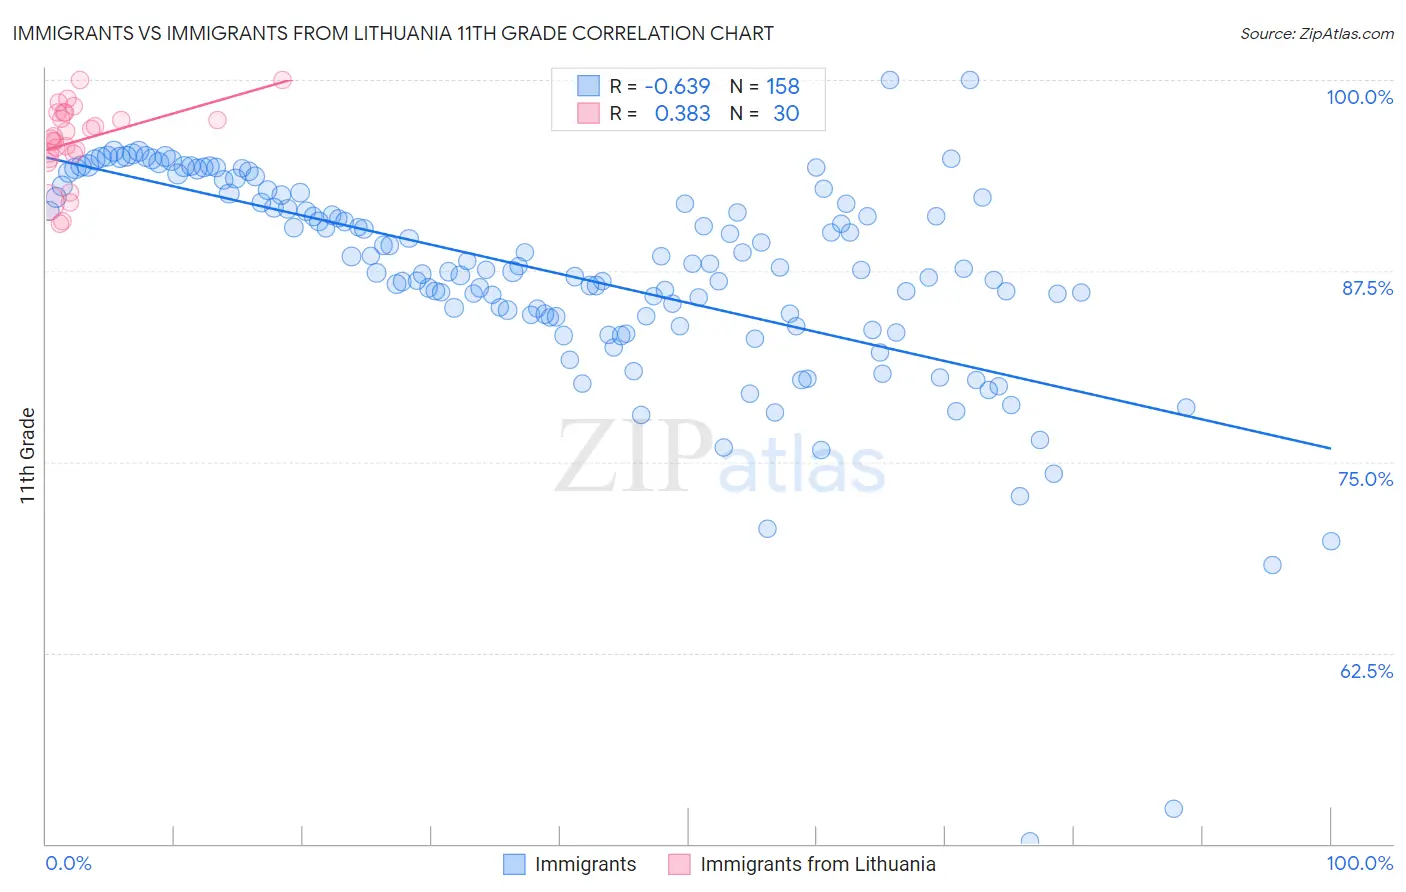
Immigrants vs Immigrants from Lithuania 11th Grade Correlation Chart
The statistical analysis conducted on geographies consisting of 577,785,939 people shows a significant negative correlation between the proportion of Immigrants and percentage of population with at least 11th grade education in the United States with a correlation coefficient (R) of -0.639 and weighted average of 89.7%. Similarly, the statistical analysis conducted on geographies consisting of 117,724,932 people shows a mild positive correlation between the proportion of Immigrants from Lithuania and percentage of population with at least 11th grade education in the United States with a correlation coefficient (R) of 0.383 and weighted average of 94.1%, a difference of 4.9%.
11th Grade Correlation Summary
| Measurement | Immigrants | Immigrants from Lithuania |
| Minimum | 50.2% | 90.6% |
| Maximum | 100.0% | 100.0% |
| Range | 49.8% | 9.4% |
| Mean | 87.3% | 96.0% |
| Median | 87.7% | 96.2% |
| Interquartile 25% (IQ1) | 84.6% | 95.2% |
| Interquartile 75% (IQ3) | 92.3% | 97.8% |
| Interquartile Range (IQR) | 7.8% | 2.6% |
| Standard Deviation (Sample) | 7.1% | 2.5% |
| Standard Deviation (Population) | 7.1% | 2.4% |
Similar Demographics by 11th Grade
Demographics Similar to Immigrants by 11th Grade
In terms of 11th grade, the demographic groups most similar to Immigrants are Yuman (89.7%, a difference of 0.0%), Immigrants from Guyana (89.7%, a difference of 0.010%), Immigrants from Cambodia (89.6%, a difference of 0.080%), Ecuadorian (89.6%, a difference of 0.13%), and Immigrants from Dominica (89.5%, a difference of 0.19%).
| Demographics | Rating | Rank | 11th Grade |
| Fijians | 0.0 /100 | #296 | Tragic 90.0% |
| Navajo | 0.0 /100 | #297 | Tragic 90.0% |
| Immigrants | Fiji | 0.0 /100 | #298 | Tragic 89.9% |
| Japanese | 0.0 /100 | #299 | Tragic 89.9% |
| Immigrants | Haiti | 0.0 /100 | #300 | Tragic 89.9% |
| Guyanese | 0.0 /100 | #301 | Tragic 89.9% |
| Immigrants | Guyana | 0.0 /100 | #302 | Tragic 89.7% |
| Immigrants | Immigrants | 0.0 /100 | #303 | Tragic 89.7% |
| Yuman | 0.0 /100 | #304 | Tragic 89.7% |
| Immigrants | Cambodia | 0.0 /100 | #305 | Tragic 89.6% |
| Ecuadorians | 0.0 /100 | #306 | Tragic 89.6% |
| Immigrants | Dominica | 0.0 /100 | #307 | Tragic 89.5% |
| Nepalese | 0.0 /100 | #308 | Tragic 89.5% |
| Immigrants | Bangladesh | 0.0 /100 | #309 | Tragic 89.5% |
| Yaqui | 0.0 /100 | #310 | Tragic 89.5% |
Demographics Similar to Immigrants from Lithuania by 11th Grade
In terms of 11th grade, the demographic groups most similar to Immigrants from Lithuania are Thai (94.1%, a difference of 0.0%), Cypriot (94.1%, a difference of 0.010%), Immigrants from Austria (94.1%, a difference of 0.020%), Greek (94.1%, a difference of 0.020%), and Immigrants from Ireland (94.1%, a difference of 0.030%).
| Demographics | Rating | Rank | 11th Grade |
| Belgians | 99.9 /100 | #32 | Exceptional 94.2% |
| British | 99.9 /100 | #33 | Exceptional 94.2% |
| Immigrants | Scotland | 99.9 /100 | #34 | Exceptional 94.2% |
| Immigrants | Singapore | 99.9 /100 | #35 | Exceptional 94.2% |
| Immigrants | Northern Europe | 99.9 /100 | #36 | Exceptional 94.2% |
| Northern Europeans | 99.9 /100 | #37 | Exceptional 94.2% |
| Hungarians | 99.9 /100 | #38 | Exceptional 94.2% |
| Immigrants | Lithuania | 99.9 /100 | #39 | Exceptional 94.1% |
| Thais | 99.9 /100 | #40 | Exceptional 94.1% |
| Cypriots | 99.9 /100 | #41 | Exceptional 94.1% |
| Immigrants | Austria | 99.9 /100 | #42 | Exceptional 94.1% |
| Greeks | 99.9 /100 | #43 | Exceptional 94.1% |
| Immigrants | Ireland | 99.9 /100 | #44 | Exceptional 94.1% |
| Australians | 99.9 /100 | #45 | Exceptional 94.1% |
| Serbians | 99.9 /100 | #46 | Exceptional 94.1% |